


Didactum Monitoring Systems
Step-by-Step Guide
Complete setup guide for your Didactum monitoring unit – from the first IP connection to user management.
Connecting via IP Address
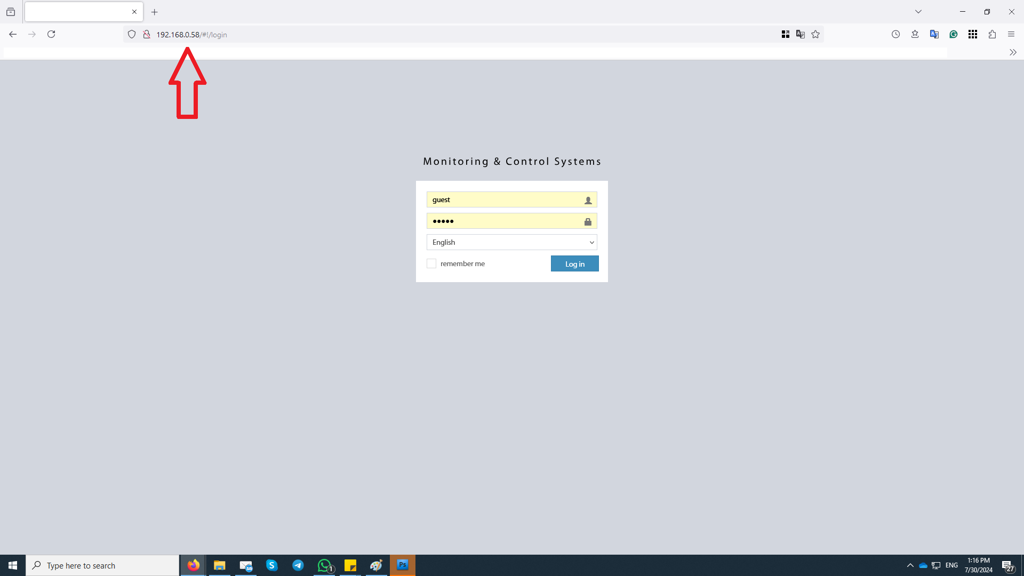
▼Configuration and monitoring of your Didactum unit is done via the integrated web interface. Simply access it through a browser – Firefox, Chrome or Safari are recommended (Internet Explorer is not fully supported).
 🔍 Enlarge
Enter the IP address of your Didactum unit in the address bar and confirm with Enter. The web interface will open directly.
Factory Network Settings
| Parameter | Value |
|---|---|
| DHCP Client | Disabled |
| Hostname | Didactum |
| IP Address Didactum 50T | 192.168.0.101 |
| IP Address Didactum 100T | 192.168.0.101 |
| IP Address Didactum 500T | 192.168.0.101 |
| IP Address Didactum 550T | 192.168.0.101 |
| Subnet Mask | 255.255.255.0 |
| Gateway | 192.168.0.1 |
| Primary DNS | 192.168.0.1 |
255.255.255.0 and IP address 192.168.0.XXX (where XXX is a number from 1–192 or 194–254).Change Network Settings on PC (Windows)
- Press Windows key → open Control Panel
- Open Network Connections
- Right-click on Local Area Connection → Properties
- Double-click on Internet Protocol (TCP/IP)
- Enter IP address and subnet mask as specified above and confirm
Interface & Overall Statistics Panel
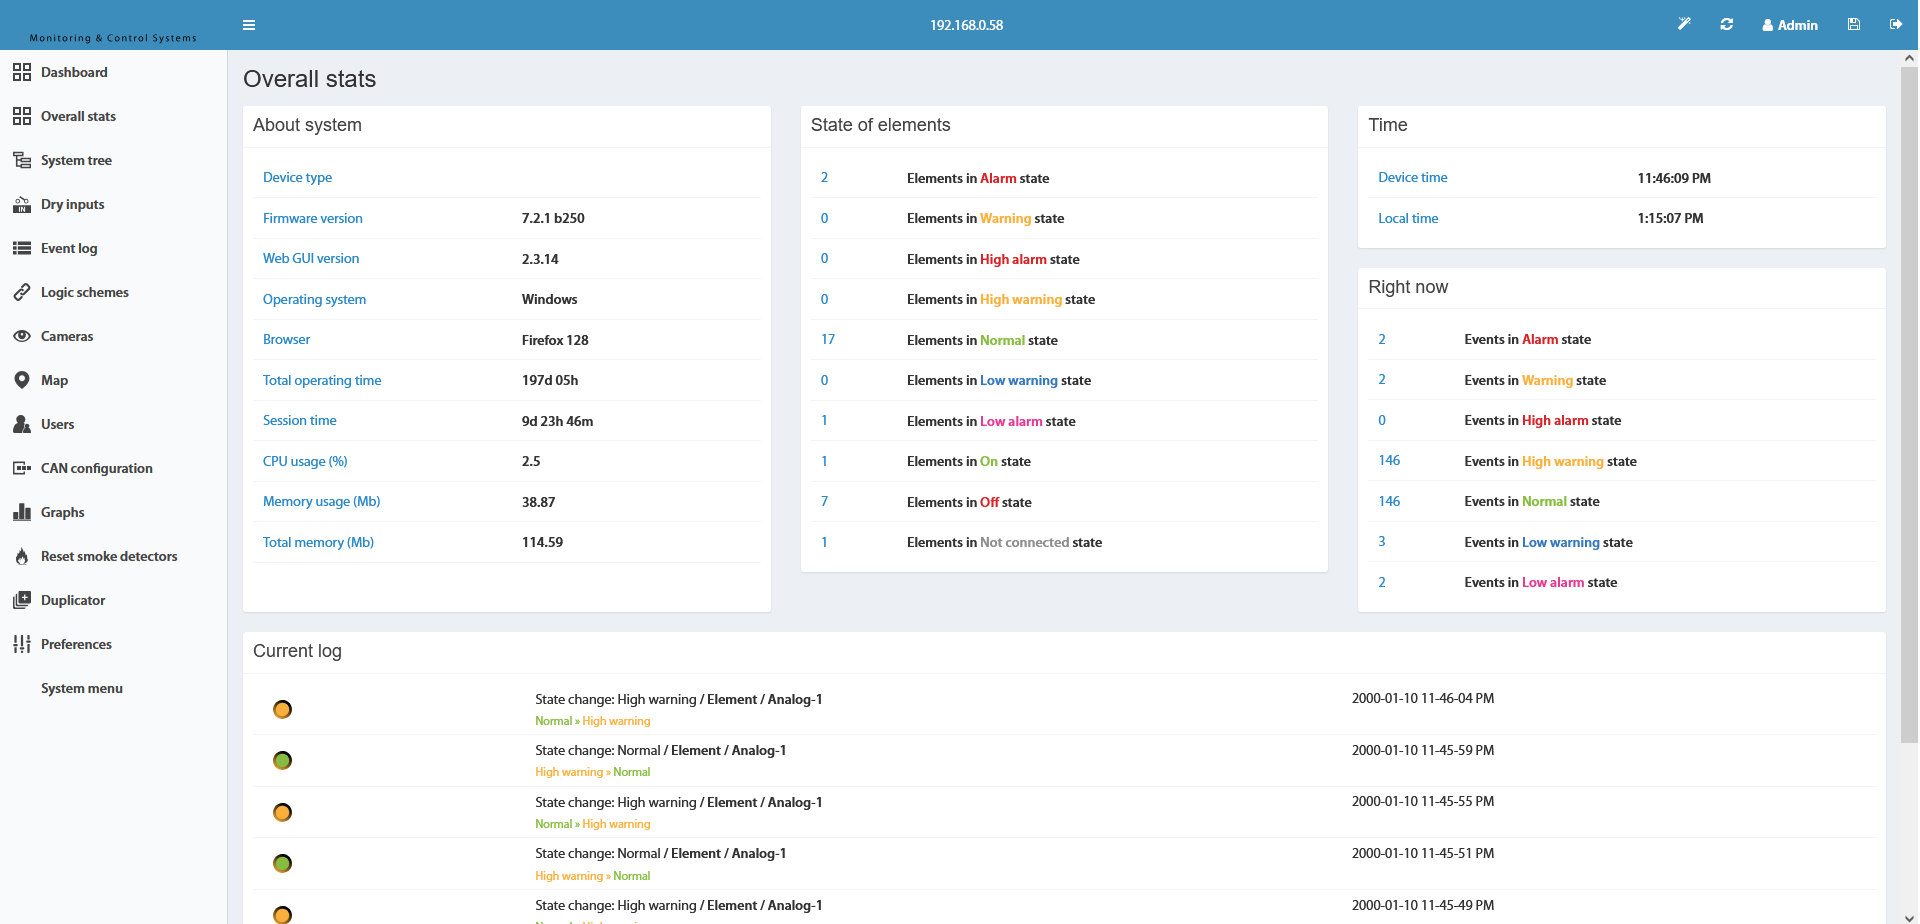
▼The integrated web interface of the Didactum systems offers a powerful and intuitive user interface for managing all connected sensors, devices and environmental systems.
 🔍 Enlarge
Widgets in the Overall Statistics Panel
| Widget | Description |
|---|---|
| Current | Number of elements in the states: very low, low, normal, warning, alarm |
| Element States | Overall overview of all elements by status |
| Current Log | The last 5 syslog events |
| About the System | Uptime, browser, firmware version |
| Time | Device time and local browser time |
Top Toolbar
| Icon | Function |
|---|---|
| ☰ Main Menu | Show/hide left navigation menu |
| ✎️ Pencil (Wizard) | Start Initial Setup Wizard (language, time, network, SNMP, user) |
| + Add Element | Add new element to the panel |
| Username | Shows the currently logged-in user |
| 💾 Save to Flash | Important: Permanently save settings to flash memory – otherwise changes will be lost on reboot! |
| ⏏ Logout | End web interface session |
 🔍 Enlarge
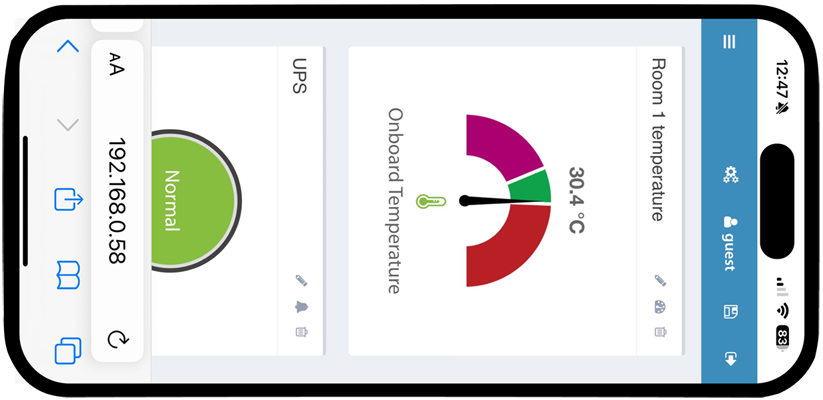
The web interface is fully optimized for smartphones and tablets. All functions can be conveniently accessed and controlled on the go via mobile browser.
Main Menu (left sidebar)
| Menu Item | Function |
|---|---|
| Dashboard | Configurable dashboard with sensor widgets |
| Overall Statistics | General system overview |
| System Tree | All sensors and devices in tree structure |
| Dry Contacts Out | Configuration of dry contact outputs |
| Dry Contacts In | Configuration of dry contact inputs |
| Event Log | System log / Syslog |
| Logic Circuits | Define automatic actions on events |
| Cameras | Display all connected cameras |
| Map | Visually place sensors on a floor plan |
| Users | Manage user accounts and permissions |
| Graphs | Compare historical sensor values |
| Settings | Network, Time, SNMP, SMTP, RADIUS, VPN etc. |
| System Menu | Firmware update, export, restart, support |
Initial Setup Wizard
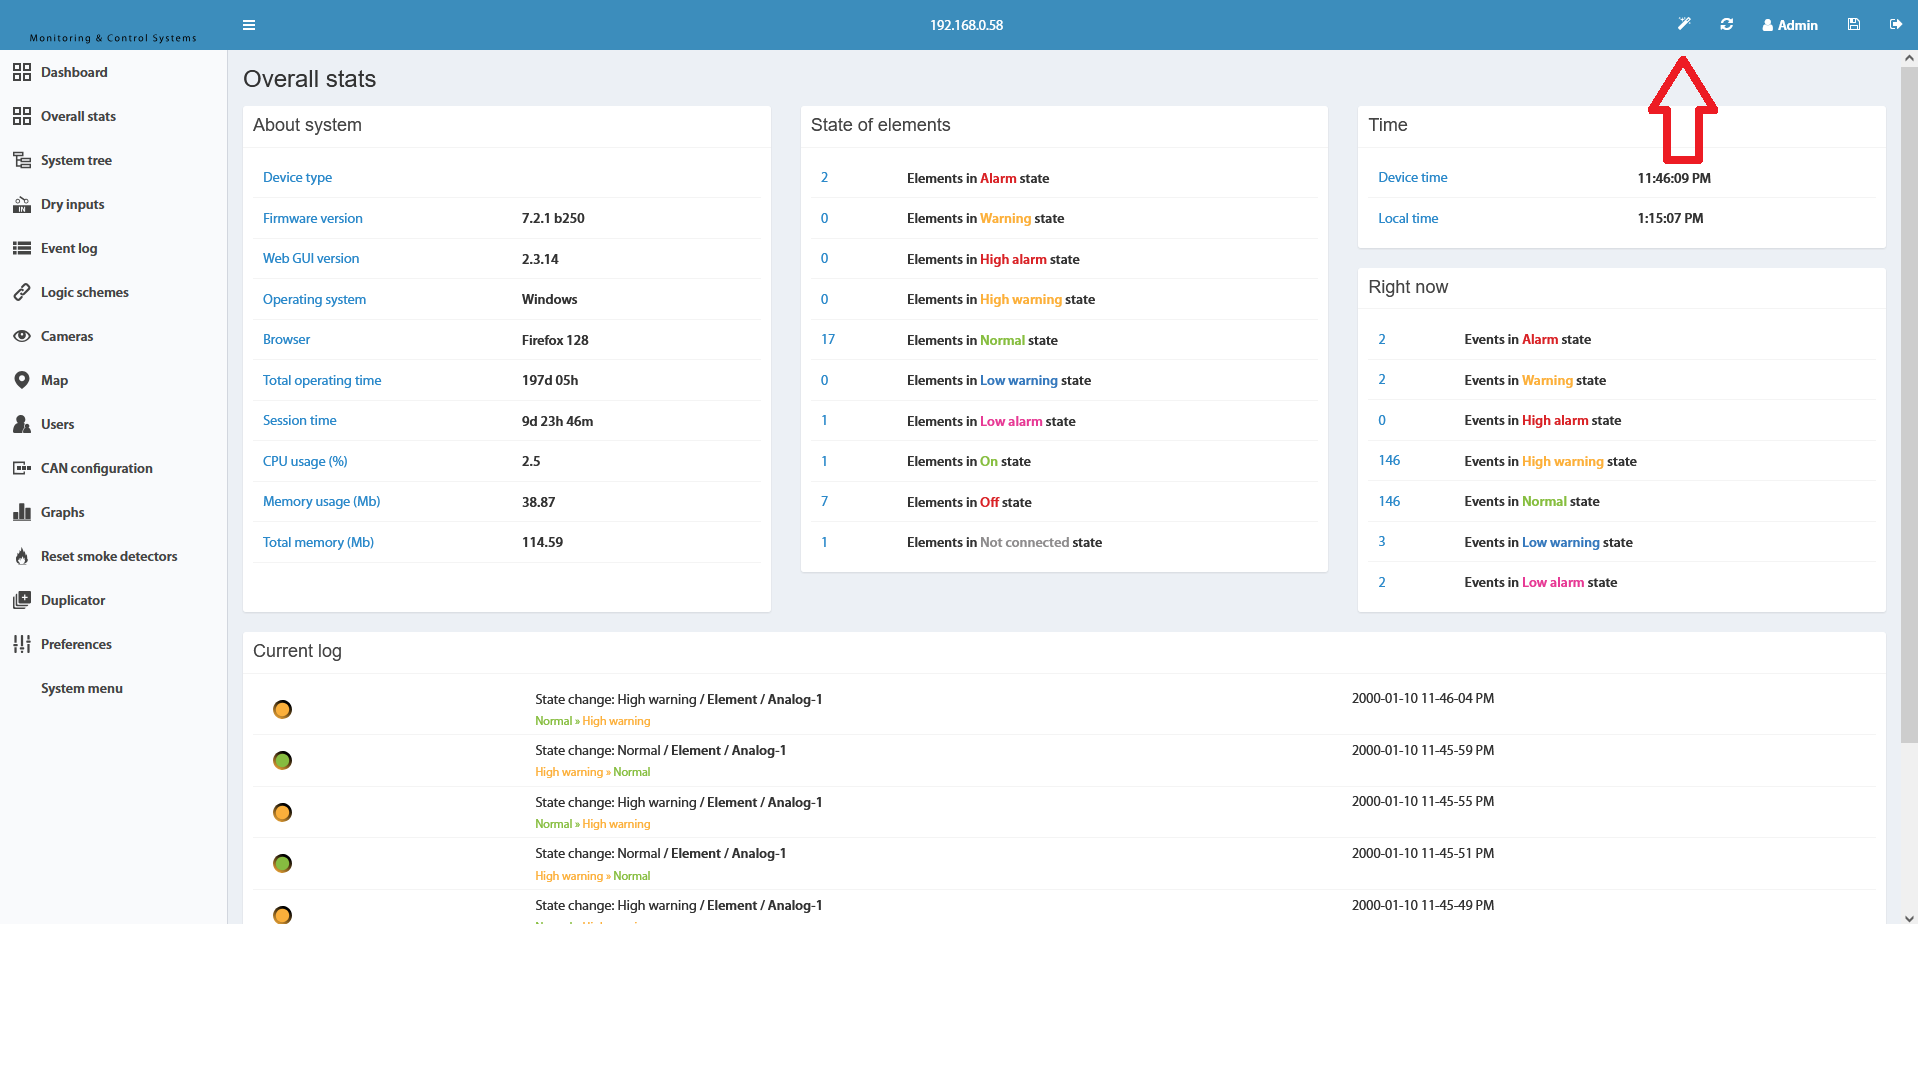
▼The Initial Setup Wizard guides you through all important basic settings during the first commissioning: language, time, network, SNMP and user account.
 🔍 Enlarge
Click on the Pencil icon ✎️ at the top right of the web interface to open the wizard.
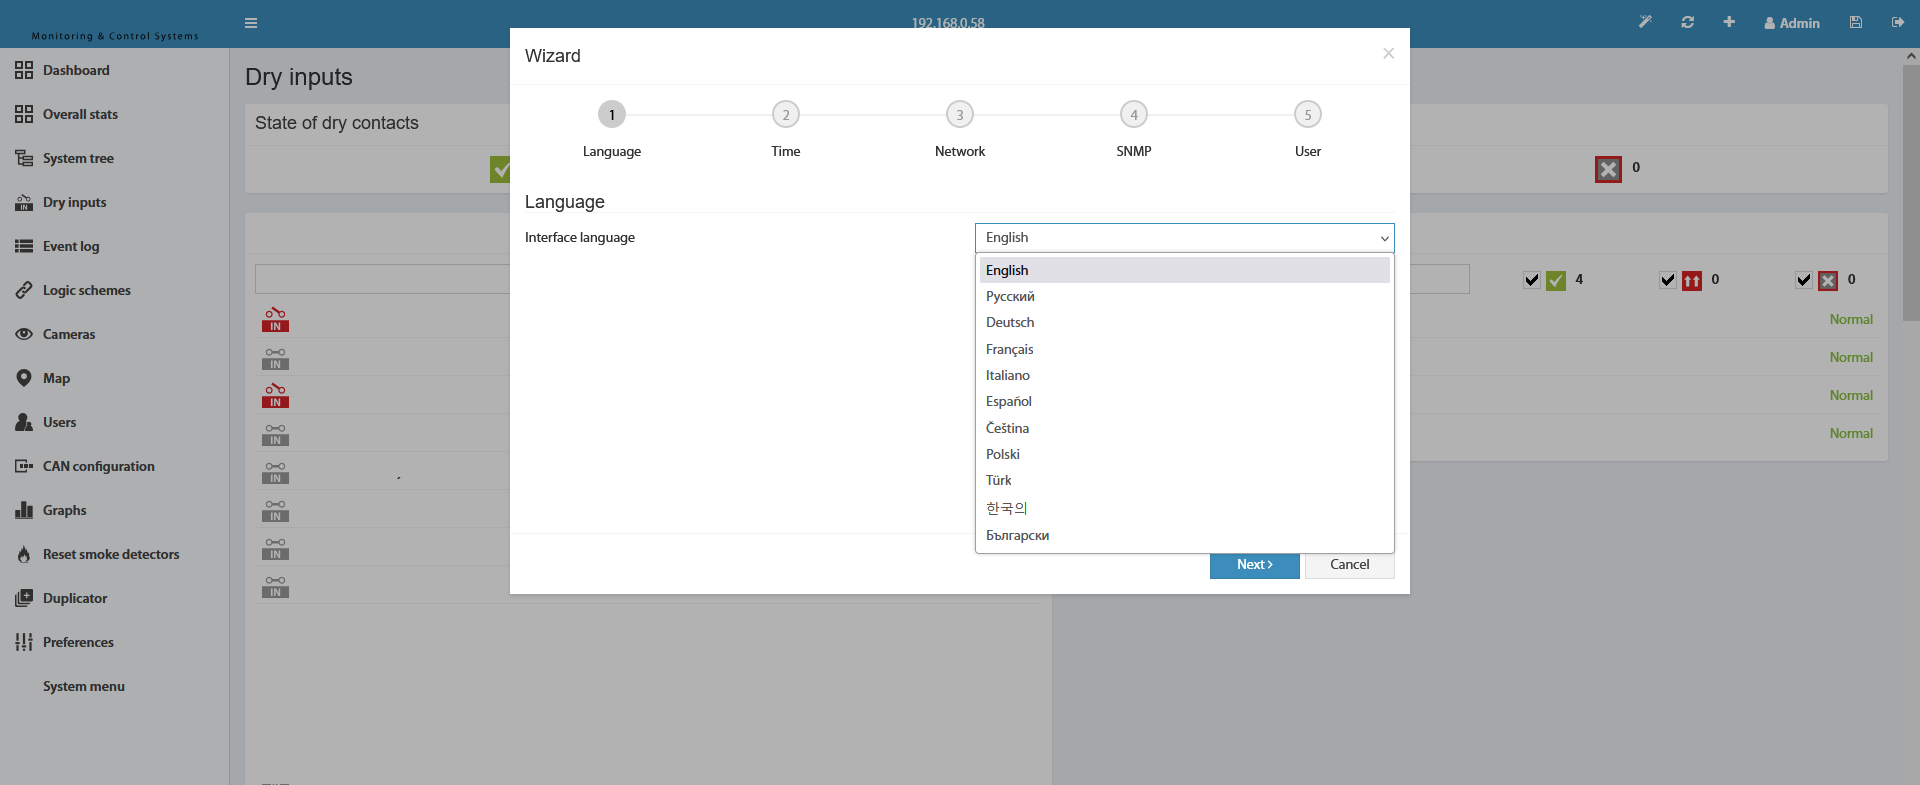
Step 1 – Select Language
 🔍 Enlarge
Available languages: English, Russian, German, French, Italian, Spanish, Czech, Polish, Turkish, Chinese, Bulgarian.
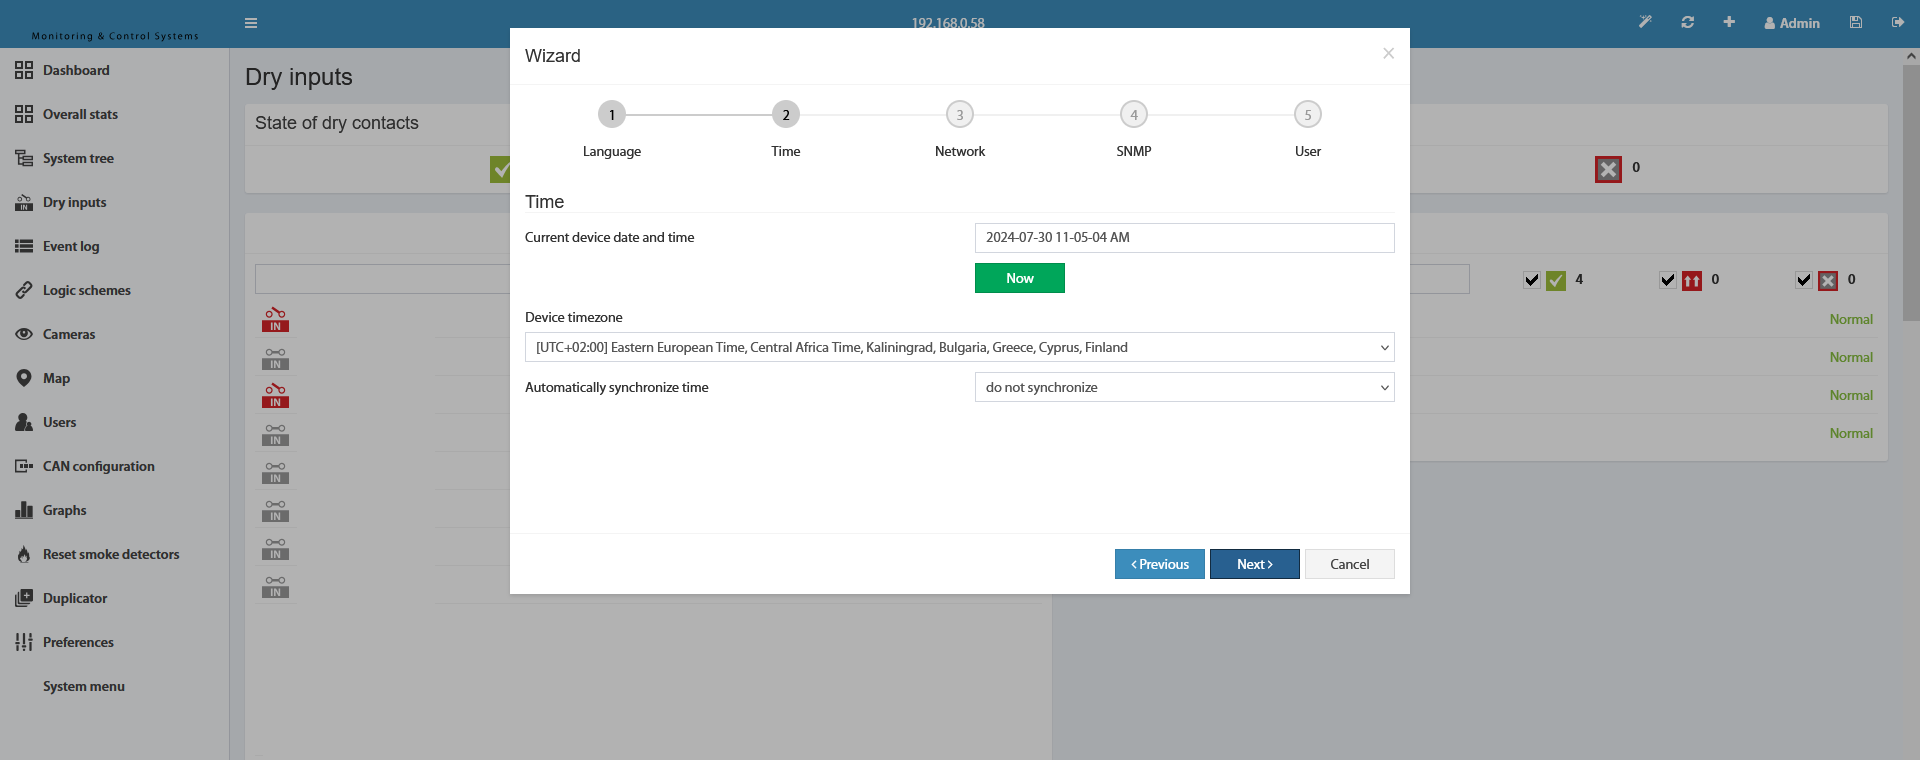
Step 2 – Configure Time
 🔍 Enlarge
Current device time: Manual entry according to your PC/mobile device
Time zone: Select your device time zone
Automatic synchronization: Enable NTP server (recommended)
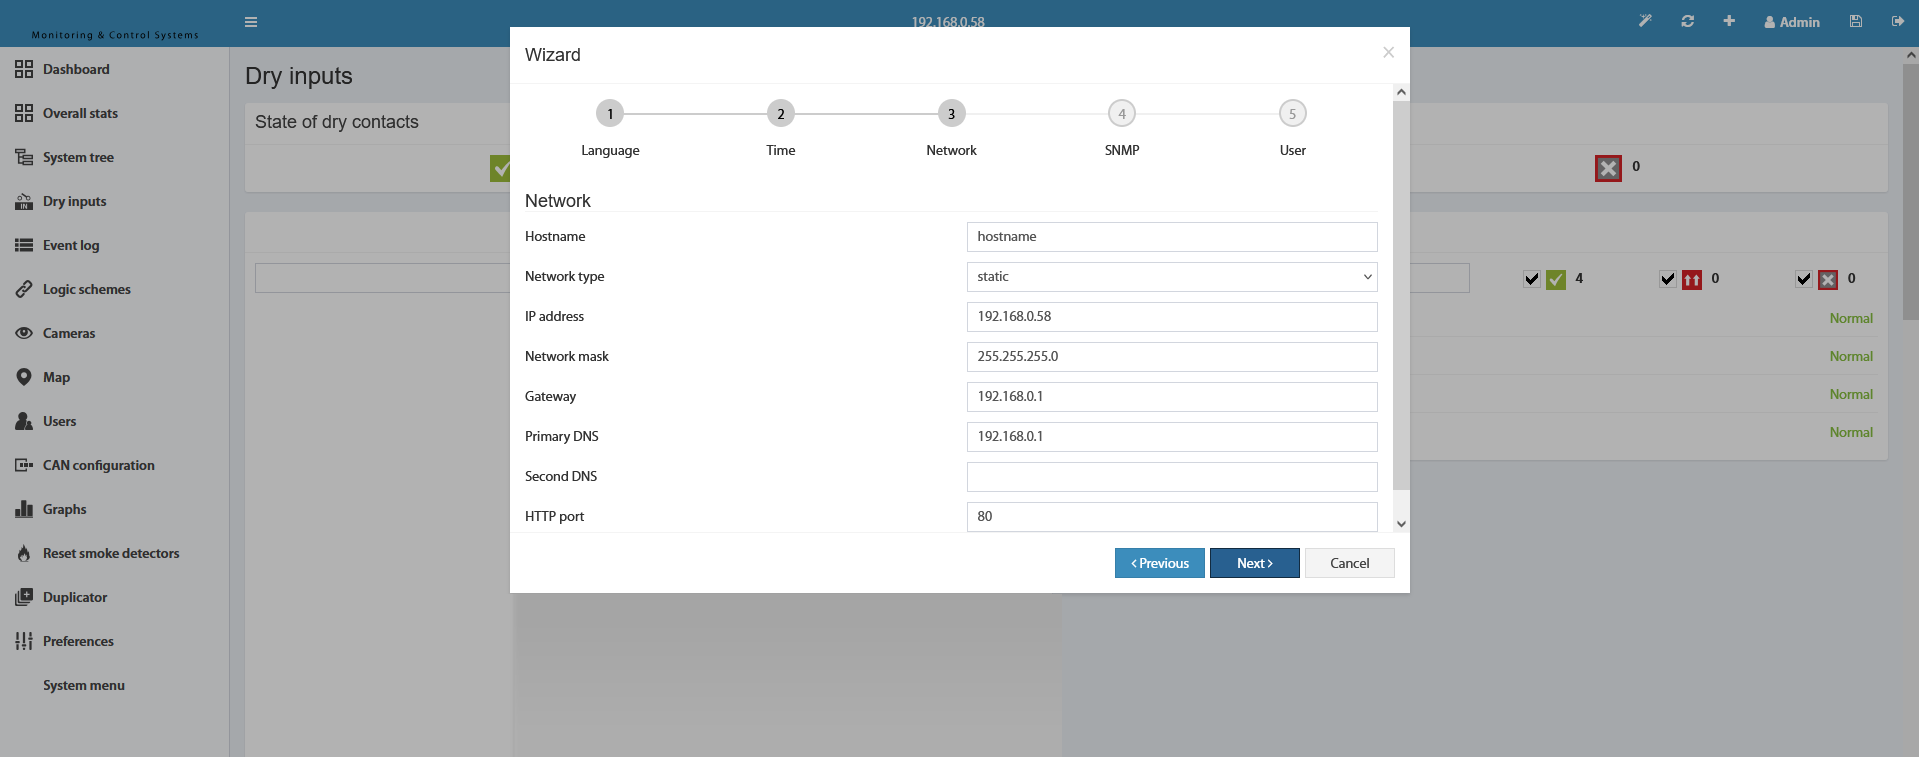
Step 3 – Network Settings
 🔍 Enlarge
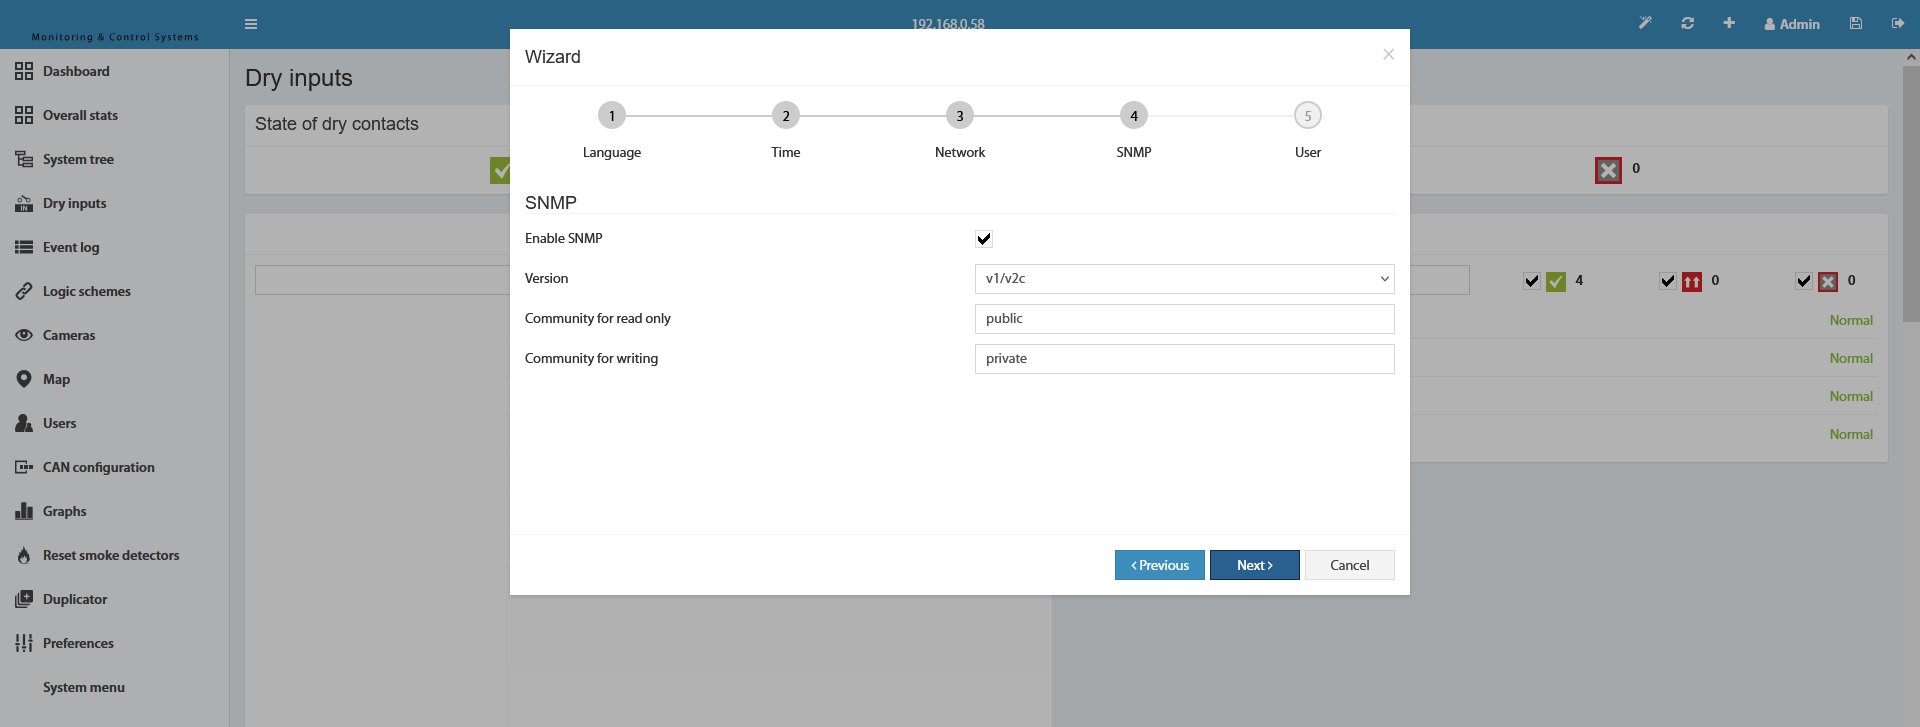
Step 4 – SNMP Settings
 🔍 Enlarge
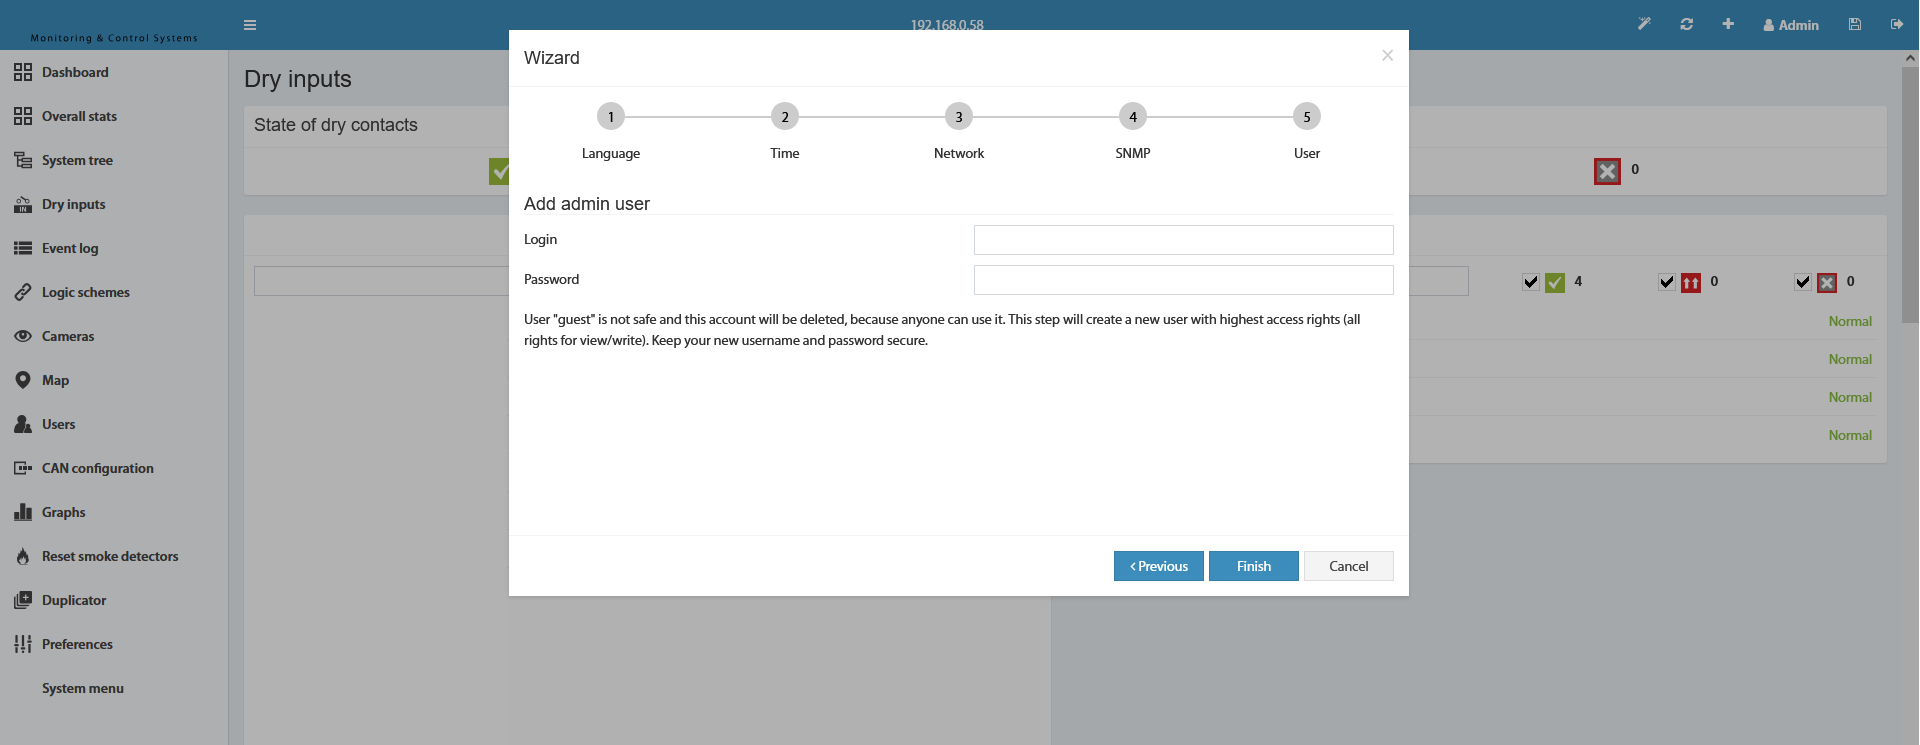
Step 5 – Create Administrator Account
 🔍 Enlarge
Configure Dashboard
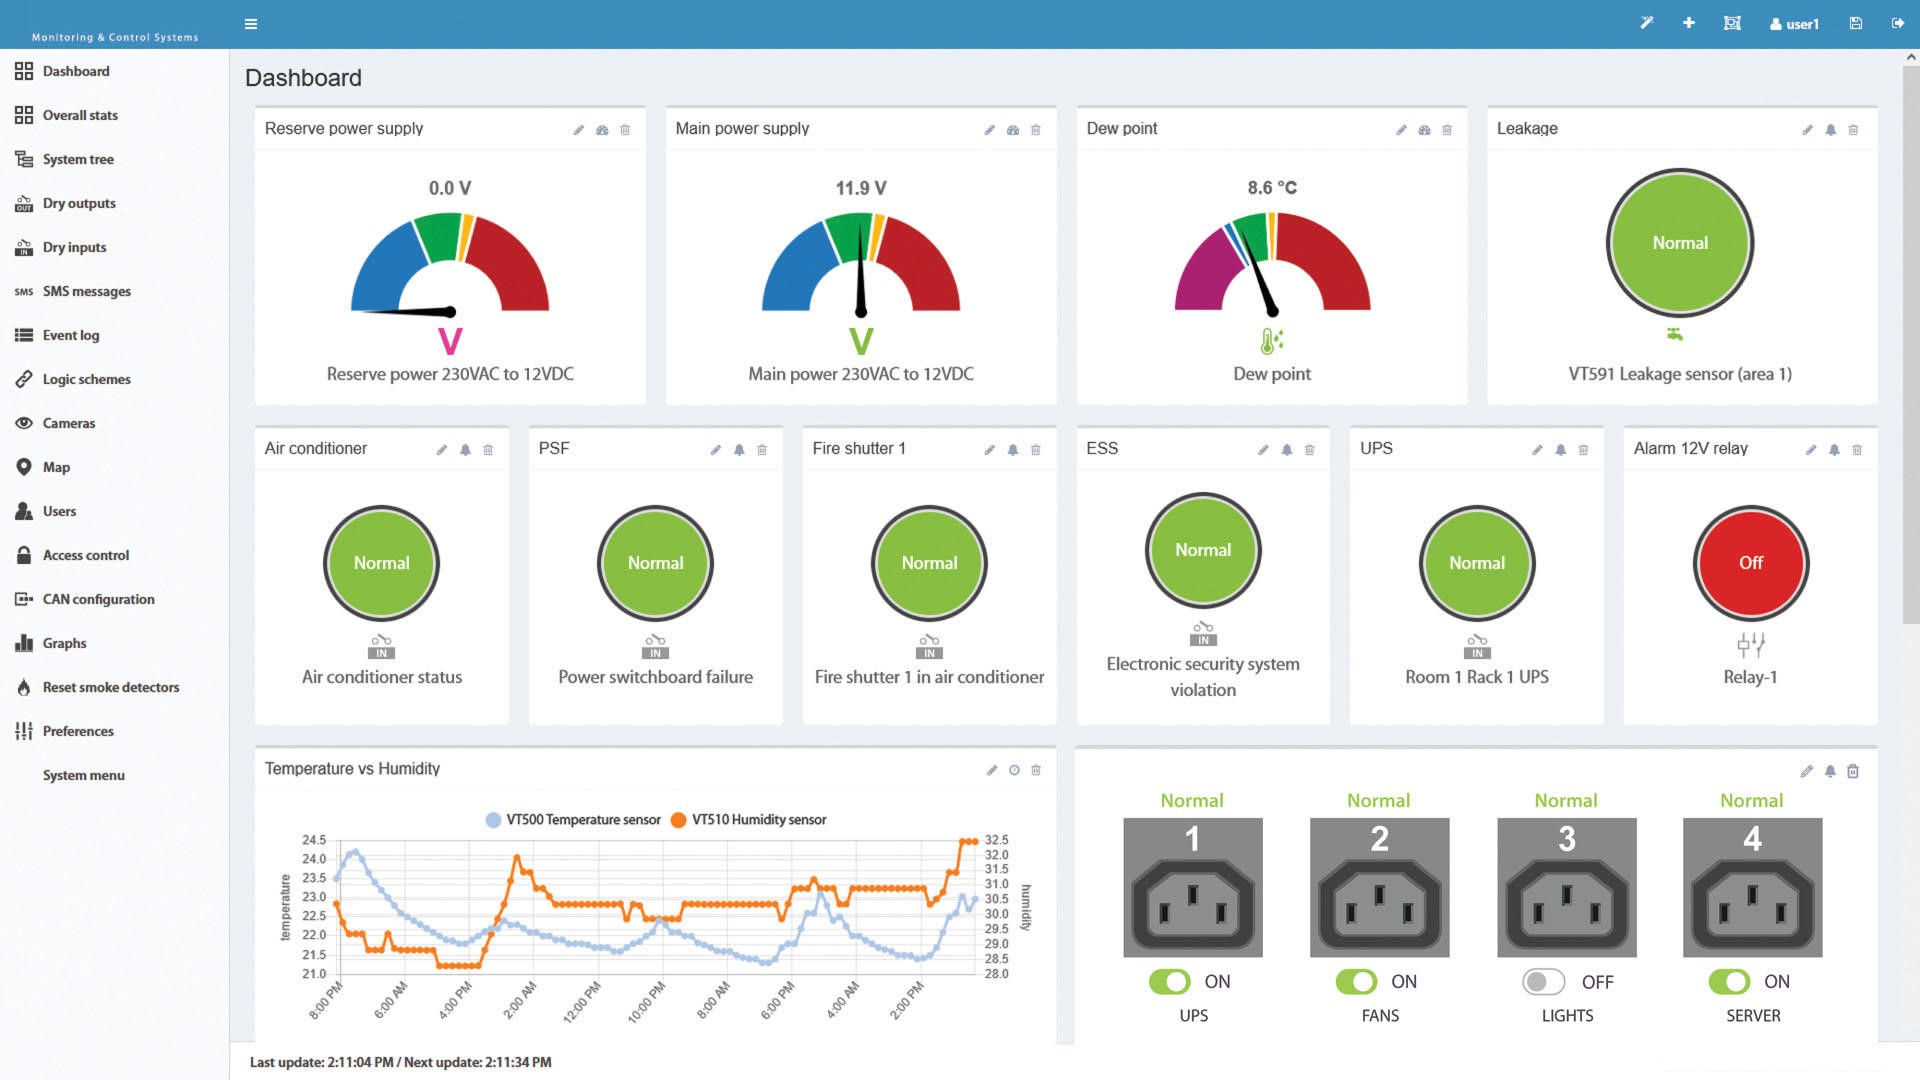
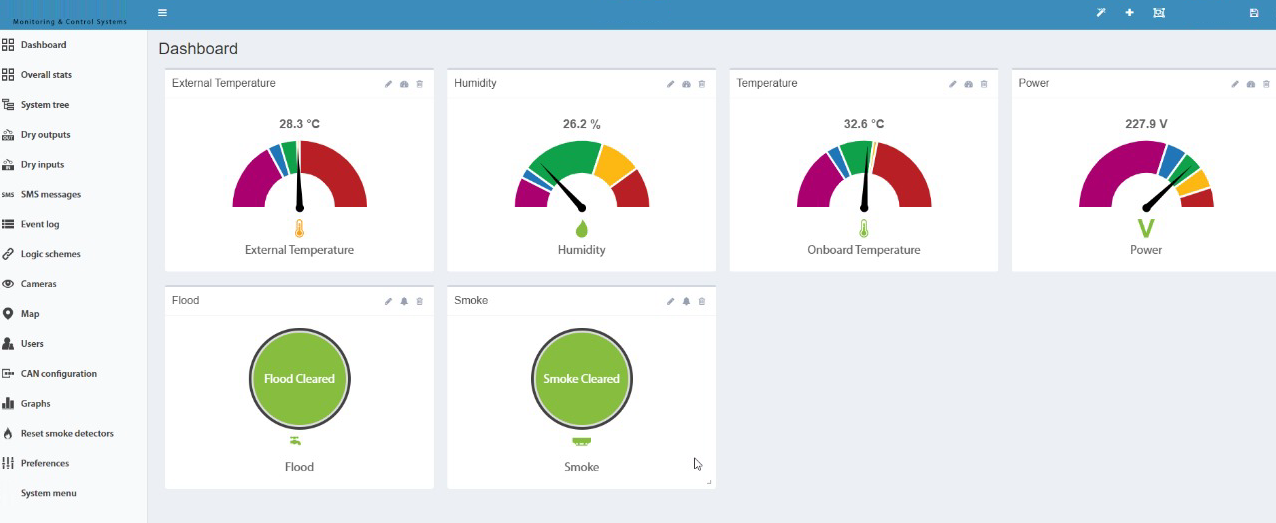
▼The dashboard can be customized individually for each user. Display the most important sensor and device values in a clear visual form.
 🔍 Enlarge
Every user can design their own dashboard with any sensors and widgets. The display automatically adapts to the data type.
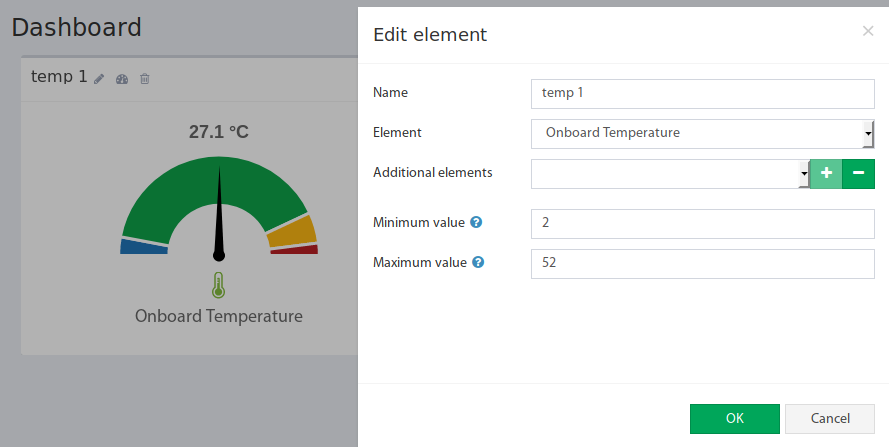
Add Analog Sensors
 🔍 Enlarge
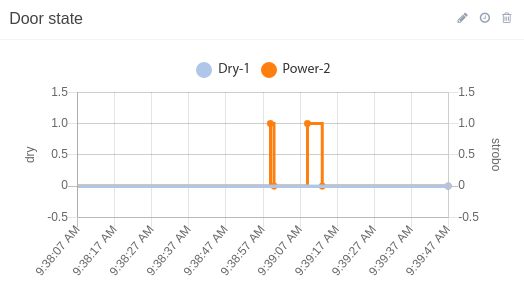
Discrete Sensors & Switching Elements
 🔍 Enlarge
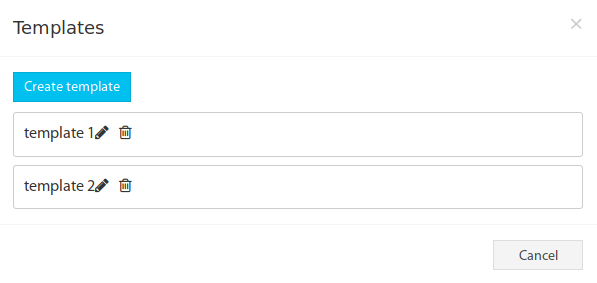
Dashboard Templates
 🔍 Enlarge
Settings – Customize Web Interface
▼Under Main Menu → Settings → WebGUI you can customize the appearance and behavior of the web interface.
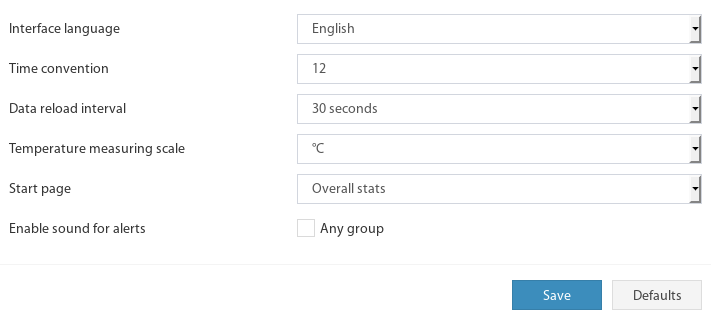 🔍 Enlarge
| Setting | Description |
|---|---|
| Interface Language | Select web interface language |
| Time Convention | Time format: 12-hour (AM/PM) or 24-hour |
| Data Refresh Interval | How often should the displays be updated? |
| Temperature Scale | Celsius or Fahrenheit |
| Start Page | Which page opens after login? |
| Enable Alarm Sound | Browser plays a sound on alarm/warning states |
Set Date and Time
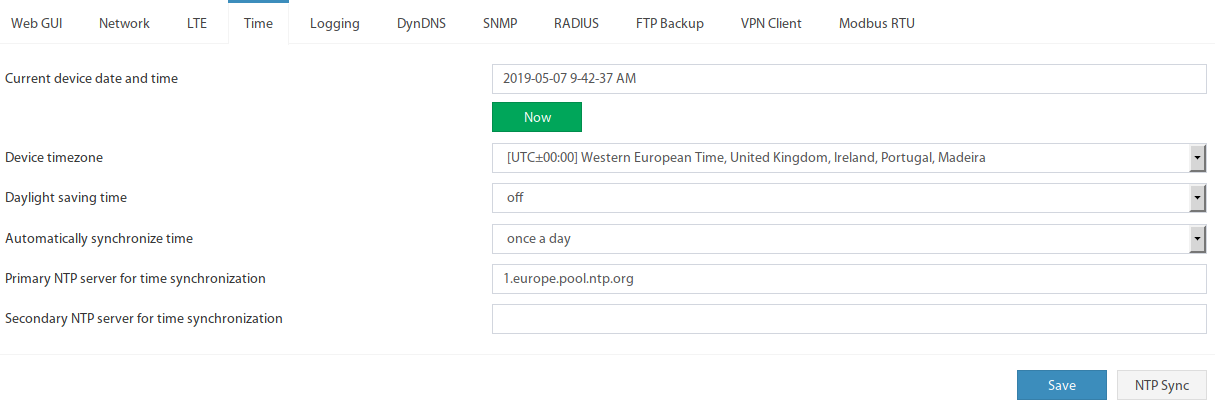
▼A correct system time is important for meaningful event logs and time-controlled actions. Go to Main Menu → Settings → Time.
 🔍 Enlarge
Enter an NTP server under Settings → Time → NTP Server, e.g.
1.europe.pool.ntp.org.1.europe.pool.ntp.org or your company's NTP server is recommended.User Management & Access Rights
▼The user panel allows management of all user accounts with individual read and write permissions. There are 3 permission levels: Guest, Operator and Administrator.
guest / Password guest – create your own administrator immediately!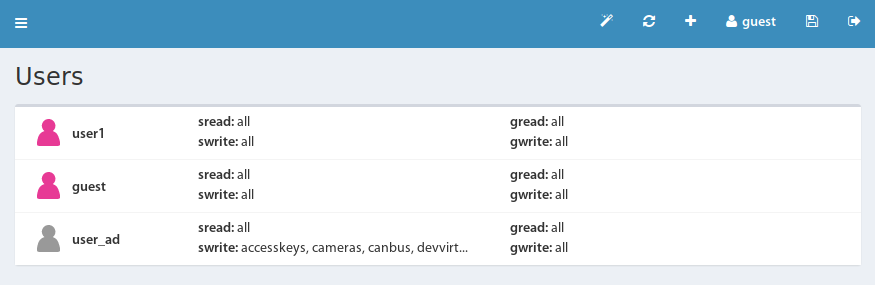 🔍 Enlarge
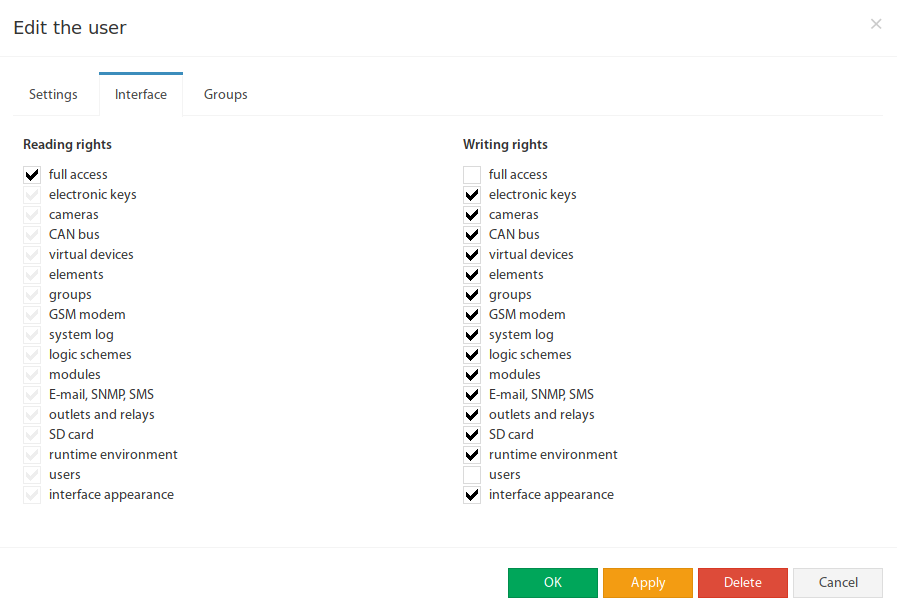 🔍 Enlarge
Available Access Rights
| Area | Read Access | Write Access |
|---|---|---|
| Full Access (Admin) | Everything including log download | Firmware, certificates, RADIUS, VPN, LTE |
| Electronic Keys | Read keys, download DB | Add/delete keys, upload DB |
| Cameras | View video stream | Add/delete IP cameras |
| CAN-Bus | Read configuration | Delete devices, save configuration |
| Virtual Elements | Read Modbus configuration | Create/delete virtual elements |
| Elements | Always available | Change elements, reset charts |
| Groups | Always available | Create/delete groups, disable notifications |
| GSM Modem | Read status and configuration | Send SMS, USSD, change configuration |
| System Log | View log messages | Configure FTP/Email log, delete log |
| Logic Circuits | View circuits | Create/delete/activate circuits |
| Notifications | Read | Create, edit, delete, test |
| Users | Read user list | Create, edit, delete accounts |
| Map | View map | Upload map image, place sensors |
Password Recovery
- Download file
reset_users.zorfrom the firmware driver area - Copy file (without renaming) to the root directory of a USB stick
- Insert USB stick into the USB port of the Didactum unit
- Wait – the red ERR-LED flashes during the process
- After success the ERR-LED turns off, the ACT-LED flashes briefly faster
- Remove USB stick and restart system – login again as
guest/guest
Save & Backup Settings
▼1. Save Settings as File
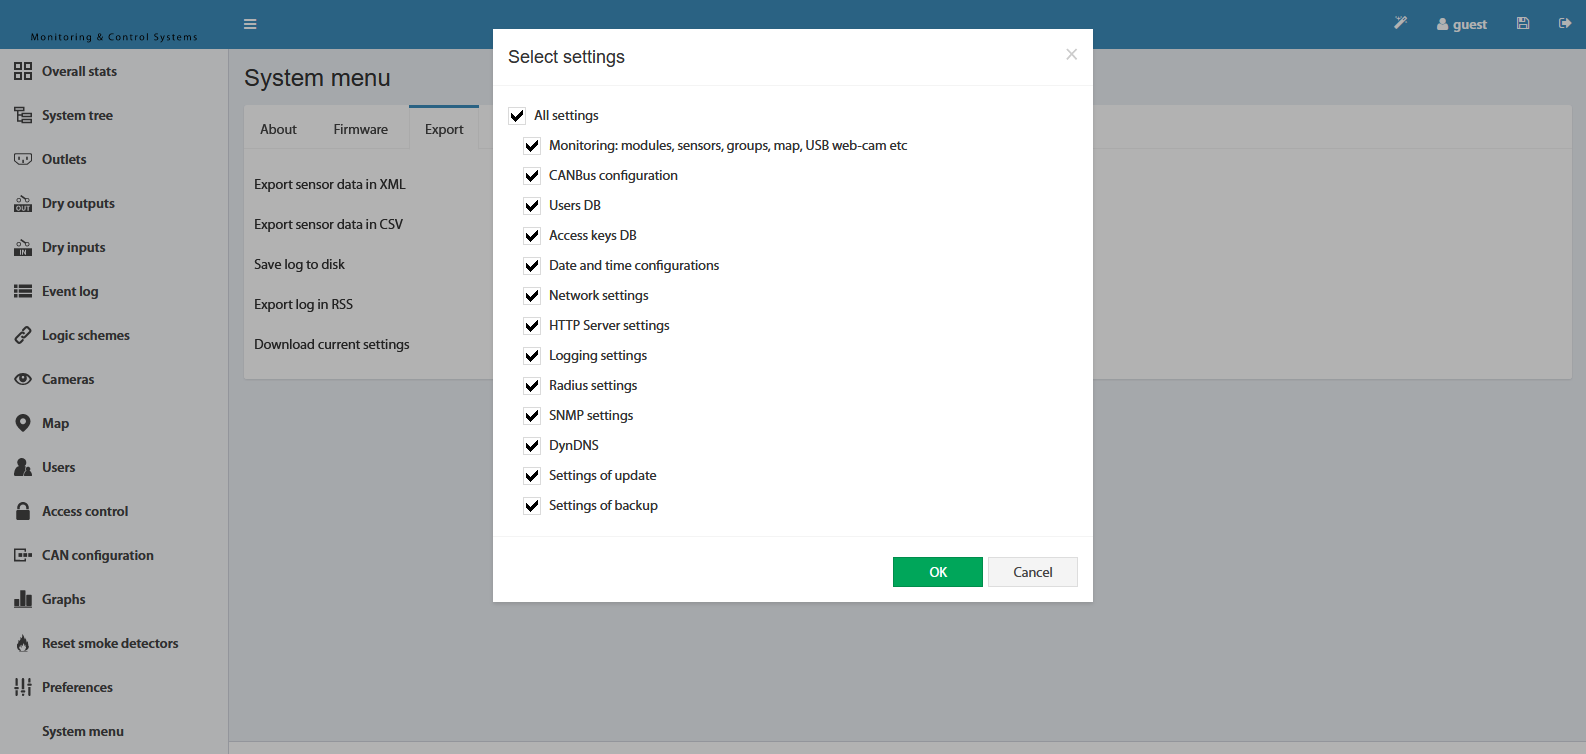 🔍 Enlarge
The file
settings.zor will be downloaded.| Parameter | Description |
|---|---|
monitoring | Sensors, modules, groups, map, USB webcam |
CANbus | CAN-Bus configuration |
dbusers | User database |
dbkeys | Access key database |
datetime | Date and time configuration |
network | Network settings |
SNMP | SNMP settings |
log | Logging settings |
backup | Backup settings |
2. Automatic Backup to USB Stick
- Insert USB stick into the USB port of the Didactum unit
- Red ERR-LED flashes briefly – the backup file is created
- Remove USB stick – file is located at:
DeviceName/backup/settings/settings.zor
3. Restore Saved Settings
- Go to System Menu → Firmware → Select File
- Select the
settings.zorfile and click "Upload" - Then press the Save to Flash button
Understanding LED Indicators
▼The front panel of your Didactum unit has several LED indicators that quickly provide information about the system status.
ACT – Activity LED (green)
| Behavior | Meaning |
|---|---|
| Blinks 1× per second | ✅ Normal operation |
| Blinks 4× per second | Firmware update completed (Recovery mode) |
| Permanently on or off | ❌ Device is hanging – restart required |
ERR – Error LED (red)
| Behavior | Meaning |
|---|---|
| Off | ✅ No error |
| Permanently on | ❌ System error present |
| Single short flash | System service restart or USB backup is being written |
| Blinks 2× per second | Firmware update in progress |
| Lights up after 5s press on RECOVERY | Recovery mode active |
CAN – CAN-Bus LED (green)
| Behavior | Meaning |
|---|---|
| Slow blinking | No CAN device connected |
| Fast blinking | CAN configuration is being loaded |
| Permanently on | ✅ CAN device(s) connected and active |
LAN Port LEDs
| LED | Color | Meaning |
|---|---|---|
| LED0 (Link) | Yellow | Blinks on network activity |
| LED3 (100M) | Green | Off = 100 Mbit/s connection active; On = no connection |
ALARM-LED – User Definable
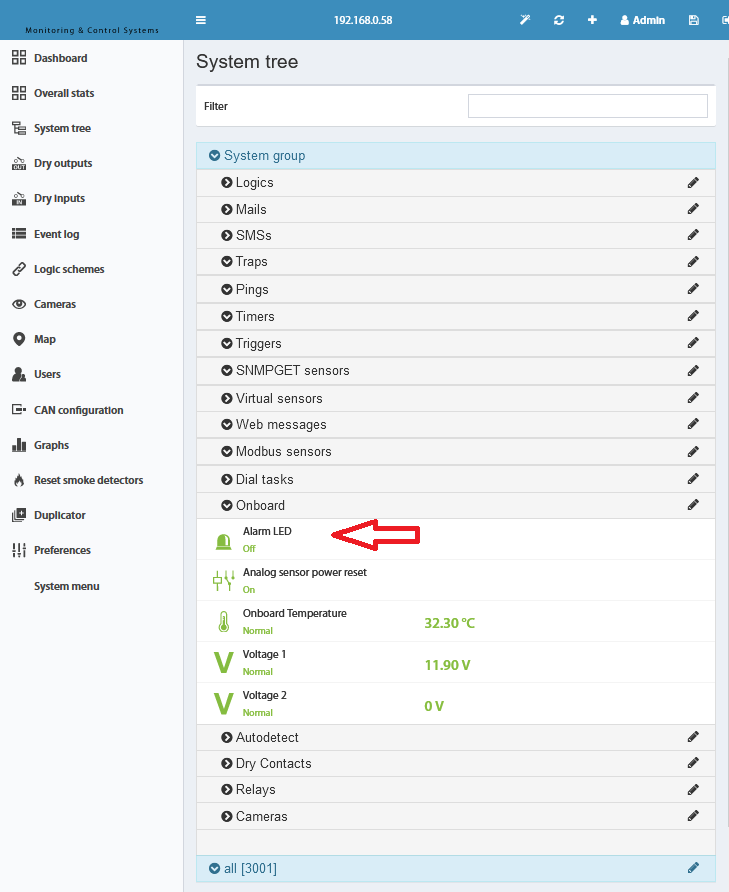 🔍 Enlarge
LTE/GSM Modem LED (green)
| Behavior | Meaning |
|---|---|
| Permanently on | Network search / call active |
| 200ms on, 200ms off | 4G network registered / data transmission |
| 800ms on, 800ms off | 2G/3G network registered |
| Off | Modem switched off or in sleep mode |
Clear Browser Cache
▼If graphs, icons or other content are not displayed correctly in the web interface, this is often due to the browser cache.
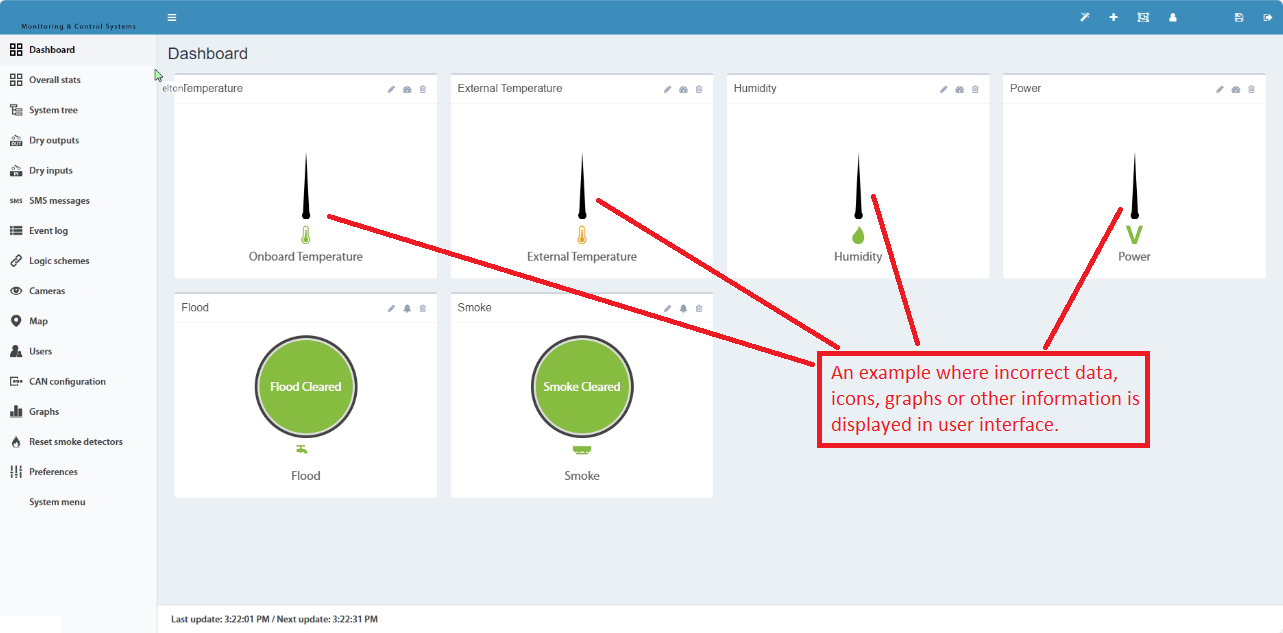 🔍 Enlarge
Graphs or symbols are displayed empty or distorted – a typical sign of outdated browser cache.
 🔍 Enlarge
Method 1 – Refresh Only This Page (recommended)
Ctrl + Shift + RmacOS:
Cmd + Shift + RMethod 2 – Clear Entire Browser Cache
| Browser | Path |
|---|---|
| Firefox | History → Clear Recent History → Select settings → Clear |
| Chrome / Edge | Settings → Privacy → Clear browsing data → Select settings → Clear |