


Didactum Monitoring Systems
Sensors, Elements & Network Monitoring
Complete guide for advanced configuration: System Tree, virtual elements, onboard sensors, sensor setup, dew point, PING, Modbus TCP and SNMP GET – for all Didactum devices.
System Tree & Virtual Elements
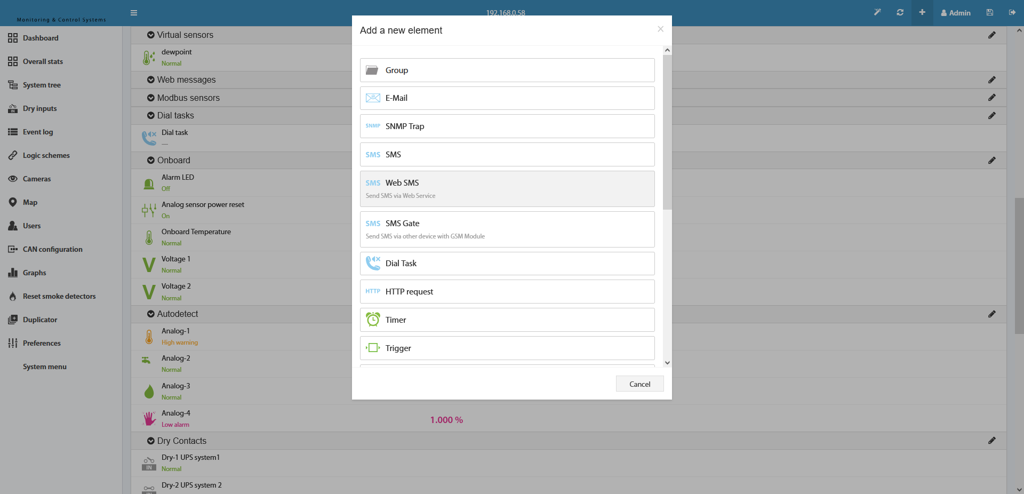
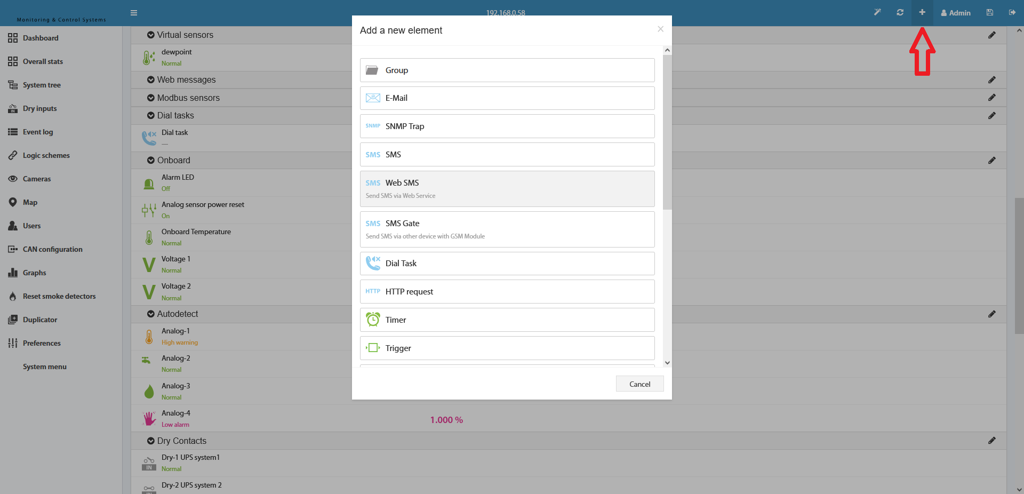
▼The System Tree is the central overview of all connected elements of your Didactum Monitoring System. Here you can add new elements, configure them, and organize them into groups.
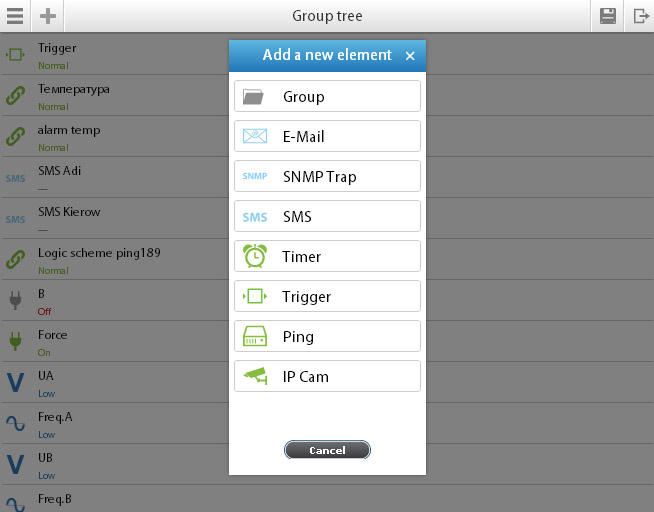
The panel contains a categorized list of all connected elements. This area allows you to create new elements, edit configurations, view graphs for each element, and create element groups. Every element can be monitored, controlled, and set up for automatic event responses.
 🔍 Enlarge
 🔍 Enlarge
Onboard Sensors
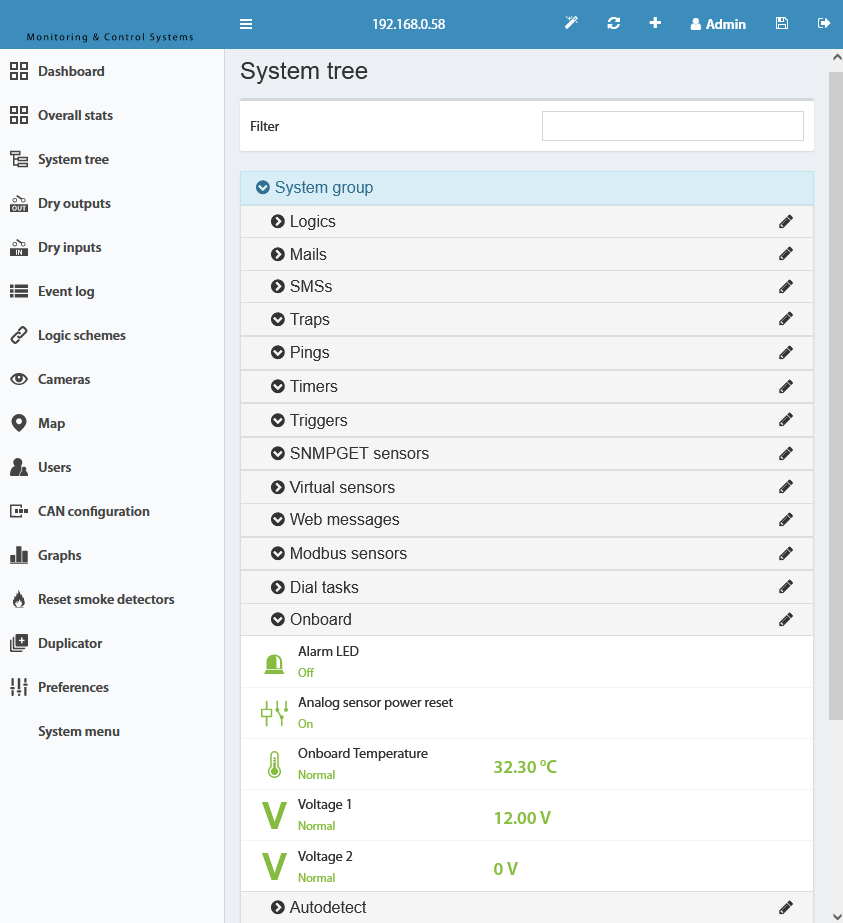
▼Every Didactum Monitoring System has built-in onboard sensors. The type and number vary depending on the device model. Onboard sensors can be used in logic schemes for automatic notifications and actions.
| Sensor | Description |
|---|---|
| Alarm-LED | The Alarm LED can be programmatically controlled via the system's logic schemes. It is automatically activated on alarm events. |
| Analogsensor-Power-Reset | When a smoke detector is triggered, it switches to Alarm mode. This can only be reset manually via the panel "Reset smoke detector" or via this onboard sensor. The sensor can also be used in logic schemes for programmatic reset. |
| Onboard-Temperature | This temperature sensor is built into the housing or protrudes from the housing depending on the device model. It can be used in logic schemes for notifications and automatic actions. |
| Voltage 1 / Voltage 2 | Voltage sensors for main and backup power supply. These elements can be used in logic schemes for notifications and actions. |
- First check the comparison table of master modules to see which sensors your device has.
- Open the Didactum Web Interface and navigate to: System Tree → Tab System Group → Tab Onboard
- All available onboard sensors are listed there and can be configured directly.
 🔍 Enlarge
Using Onboard Voltage Sensors
▼Every Didactum Monitoring System has one or two built-in voltage sensors. These measure the input voltage at the main board input and can be used in logic schemes for notifications in case of voltage drop.
If Voltage 1 is greater than Voltage 2, the system uses Voltage 1 as the power input. If Voltage 1 is less than Voltage 2, the system automatically switches to Voltage 2 as the power input.
| Voltage Value | Meaning |
|---|---|
| 5–6 V DC | Absolute minimum – below this the board switches off |
| 9 V DC | At this value NC/NO relays may not switch reliably |
| 12 V DC | Optimal operating voltage for the entire system |
| 14 V DC | Maximum voltage – above this the board may be damaged |
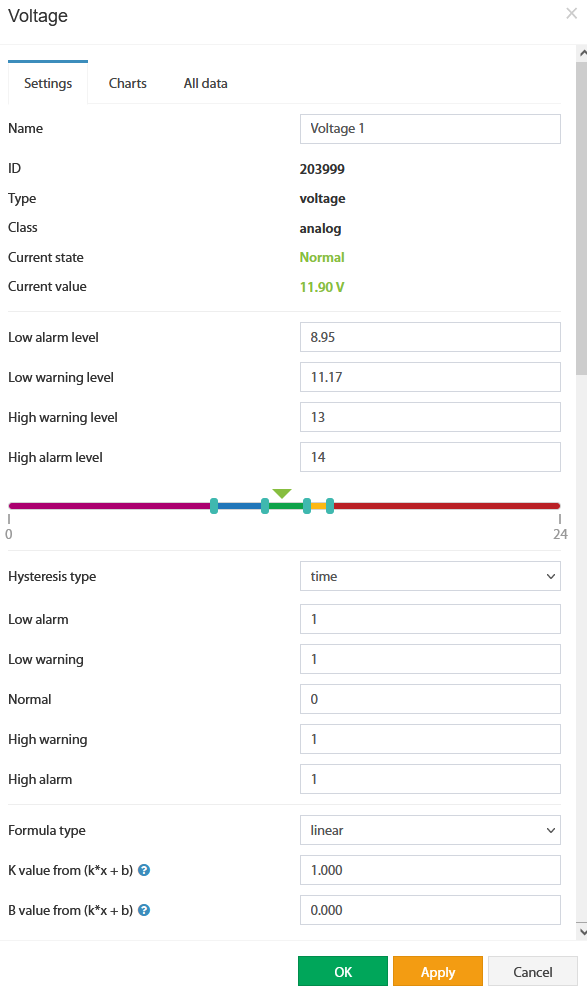
- In the Web Interface navigate to: System Tree → Tab System Group → Tab Onboard → Voltage 1 or Voltage 2
- A configuration window opens with the fields Name, ID, Type, Class, current state and current value.
- Set the threshold values (Low Alarm, Low Warning, Normal, High Warning, High Alarm) to trigger notifications in logic schemes.
- Optionally configure the hysteresis (time-based or value-based) to avoid false alarms with borderline voltages.
 🔍 Enlarge
 🔍 Enlarge
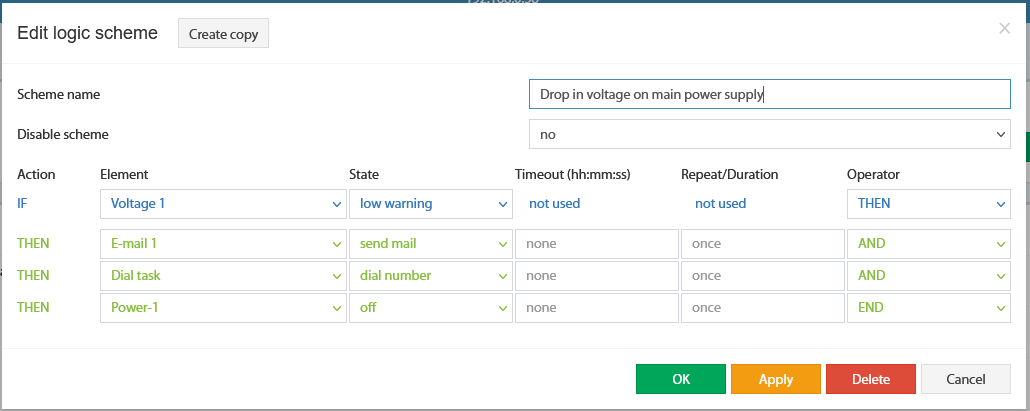
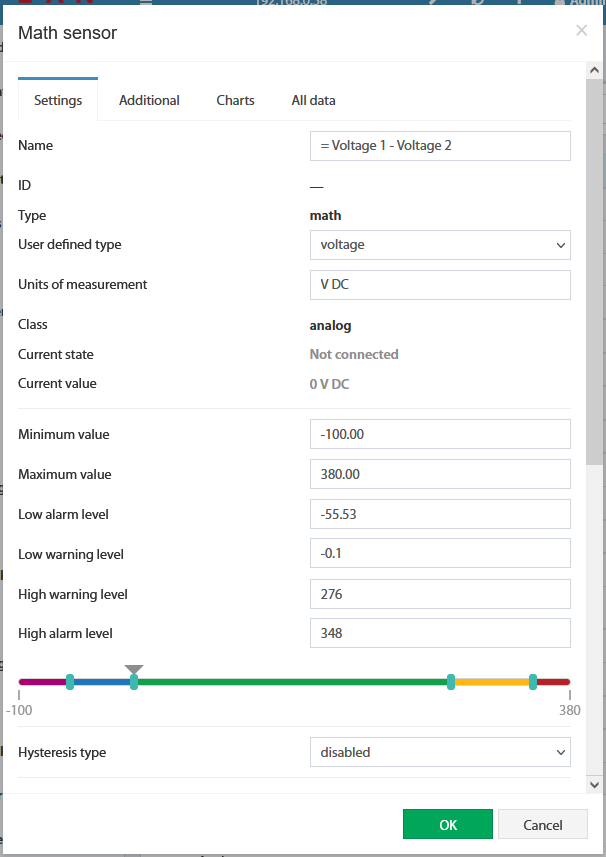
First create a Math Sensor with the formula (Voltage 1 – Voltage 2) and set the Low Warning threshold to -0.1. When Voltage 1 becomes smaller than Voltage 2, the Math Sensor switches to Warning state. Use this in the logic scheme:
 🔍 Enlarge
-0.1 under real conditions. Depending on power quality, voltage fluctuations can falsify this value.
Sensor Configuration
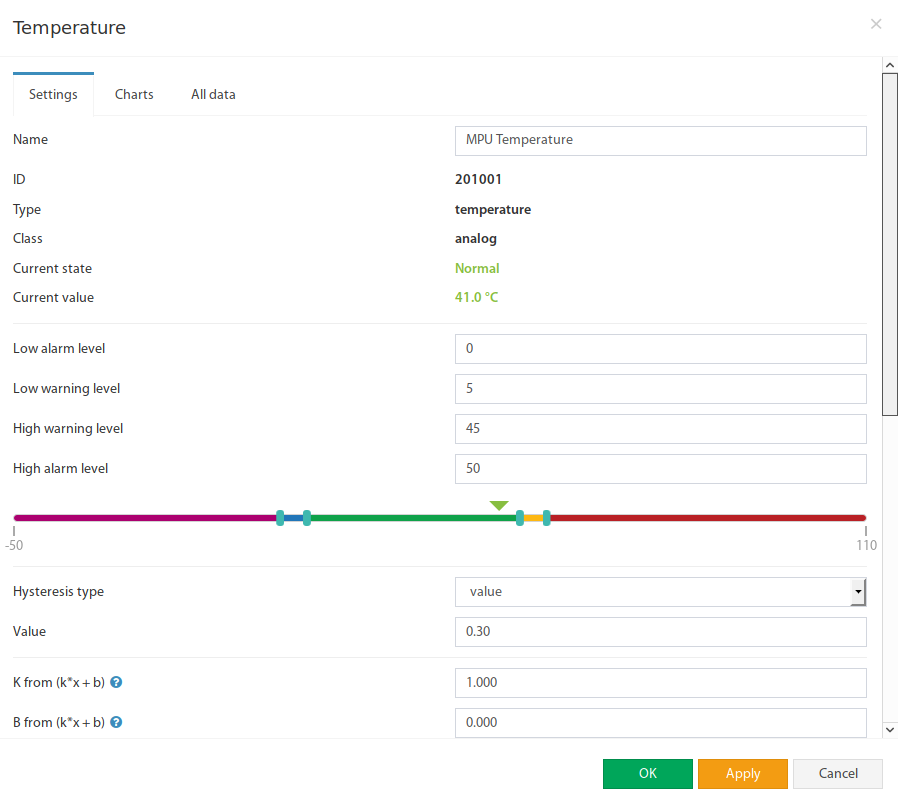
▼All connected sensors can be equipped with threshold values, hysteresis, and calibration parameters via the configuration window. The settings apply to both physical sensors and virtual elements.
- In the Didactum Web Interface navigate to Main Menu → System Tree.
- Click on the desired sensor in the tree structure. A modal properties window will open.
- Make the desired settings and click OK or Apply.
 🔍 Enlarge
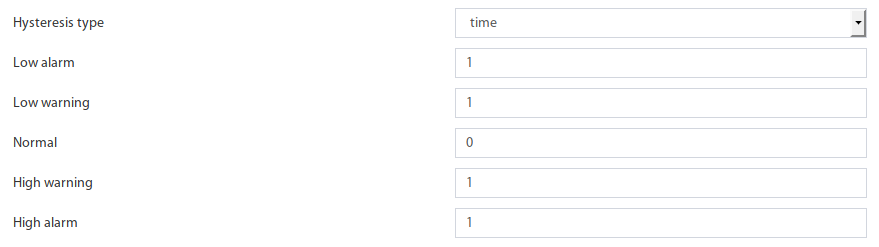
Hysteresis prevents false alarms when measured values fluctuate near a threshold. It can be set as time-based or value-based.
 🔍 Enlarge
 🔍 Enlarge
Sensor values can be calibrated using the linear formula y = k × x − b. Save the calibration values to flash memory afterwards.
20 × (x − 0.021). Always use a period as decimal separator (3,14 → 3.14).
| Function | Description |
|---|---|
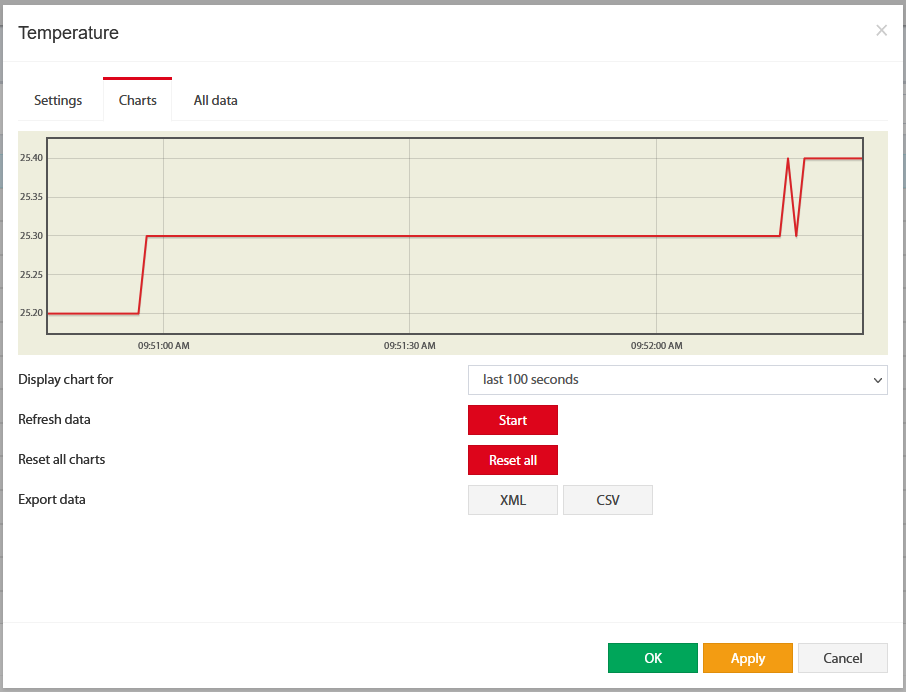
| Show chart for | Last 100 seconds / minutes / hours / days |
| Refresh data | Manually query sensor |
| Reset all charts | Delete all stored sensor data |
| Export data | XML or CSV – for longer periods please use sensor dump files |
 🔍 Enlarge
Create Dew Point Element
▼The dew point is the temperature to which air must be cooled to become saturated with water vapor. The Didactum system automatically calculates the dew point from the measured values of a connected temperature and humidity sensor.
When air is cooled below the dew point, water vapor condenses into liquid water (dew). This is particularly relevant in server rooms and data centers, as condensation on electrical components can cause short circuits. The higher the relative humidity, the higher the dew point.
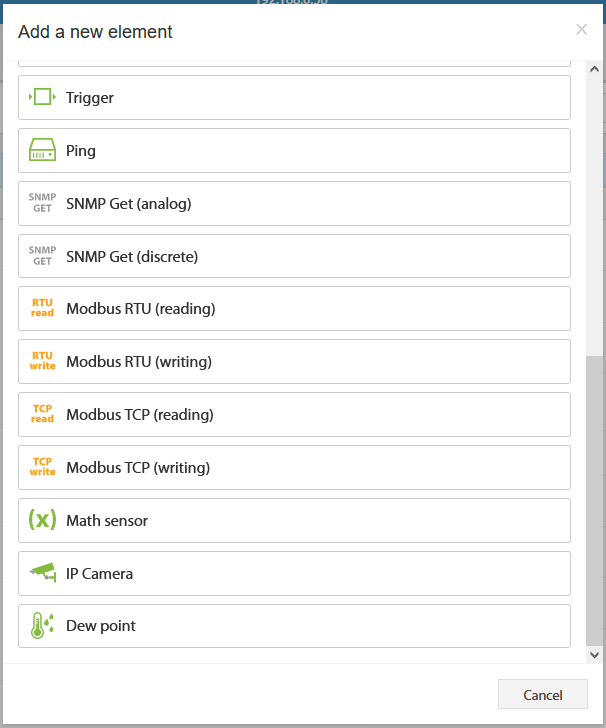
- Open the System Tree in the Didactum Web Interface and click on the + symbol.
- In the dialog window all available virtual elements appear – select Dew Point.
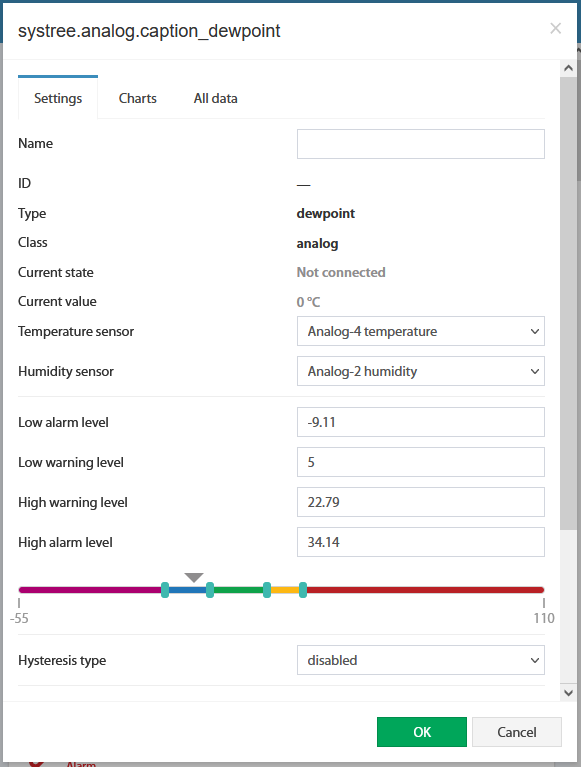
- The dew point configuration window opens.
- Select the connected temperature sensor and humidity sensor from the dropdown lists.
- Set the threshold values (Low Alarm, Low Warning, Normal, High Warning, High Alarm).
- Save the configuration with OK.
 🔍 Enlarge
 🔍 Enlarge
| Parameter | Description |
|---|---|
| Name | Freely selectable name of the dew point element |
| ID | System ID, assigned after saving |
| Type | dewpoint |
| Class | analog |
| Current State | Not connected / Connected |
| Current Value | Calculated dew point value from temp. and humidity |
| Temperature Sensor | Select connected temperature sensor |
| Humidity Sensor | Select connected humidity sensor |
| Threshold Values | Low Alarm, Low Warning, Normal, High Warning, High Alarm |
| Hysteresis Type | Time, Value or Disabled |
All saved dew point elements are located in the Web Interface under: System Tree → Virtual Sensors. Clicking an element opens the configuration window.
Create PING Element
▼The PING element checks the network reachability of a host (server, IP camera, switch, etc.). If the host fails, the element automatically switches to Alarm state – when it becomes reachable again, it returns to Normal.
Ping is a network diagnostic tool that sends ICMP echo requests and waits for replies. If no reply is received, the alarm is triggered. After the connection is restored, the sensor automatically returns to the Normal state. All Didactum Monitoring Systems support the PING element.
- In the Web Interface open the System Tree and click on the + symbol.
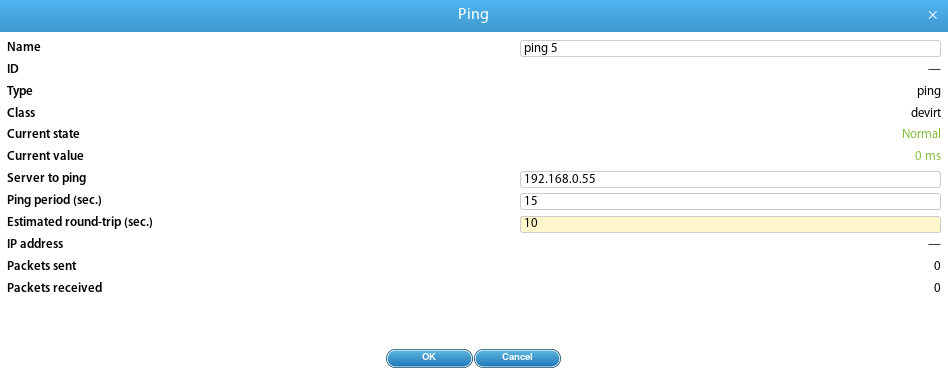
- In the dialog window select Ping. The configuration window opens.
- Enter the target address (hostname e.g.
google.comor IP address like192.168.1.1). - Set the ping interval (minimum 5 seconds).
- Enter the expected Round-Trip Time (time until expected response).
- Confirm with OK.
 🔍 Enlarge
 🔍 Enlarge
| Parameter | Description |
|---|---|
| Name | Freely selectable name of the PING element |
| Type | ping (defined by the system) |
| Class | devirt (defined by the system) |
| Current State | Normal when reachable, Alarm when unreachable |
| Current Value | Response time in milliseconds |
| Target Server / Host | Hostname (e.g. google.com) or IP address |
| Ping Interval (sec.) | Repeat interval – minimum 5 sec. |
| Expected Round-Trip Time | Time until expected server response |
| IP Address | Resolved IP address of the server (automatic) |
| Packets Sent | Number of sent ICMP packets |
| Packets Received | Number of received reply packets |
Virtual Modbus TCP Element (linked)
▼With virtual Modbus TCP elements you can integrate external Modbus TCP devices (e.g. energy meters, UPS systems, industrial sensors) into the Didactum Monitoring System. Each measured value is displayed as a separate element in the System Tree.
Modbus TCP is a widely used industrial protocol for communication with measuring devices via Ethernet. The Didactum system supports both reading and writing Modbus TCP elements. Each register value of a Modbus device (e.g. voltage, current, power) is represented by a separate virtual element.
 🔍 Enlarge
- In the Web Interface open the System Tree and click on the + symbol.
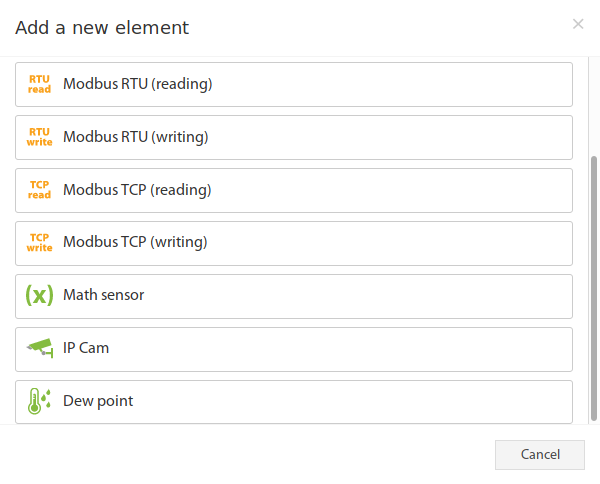
- In the dialog select Modbus TCP (Read) or Modbus TCP (Write).
- Enter the IP address and port (default: 502) of the Modbus device.
- Enter the Slave ID and register address.
- Set threshold values and optionally a calculation formula.
- Save with OK. Repeat this process for each additional measured value.
Create SNMP GET Element
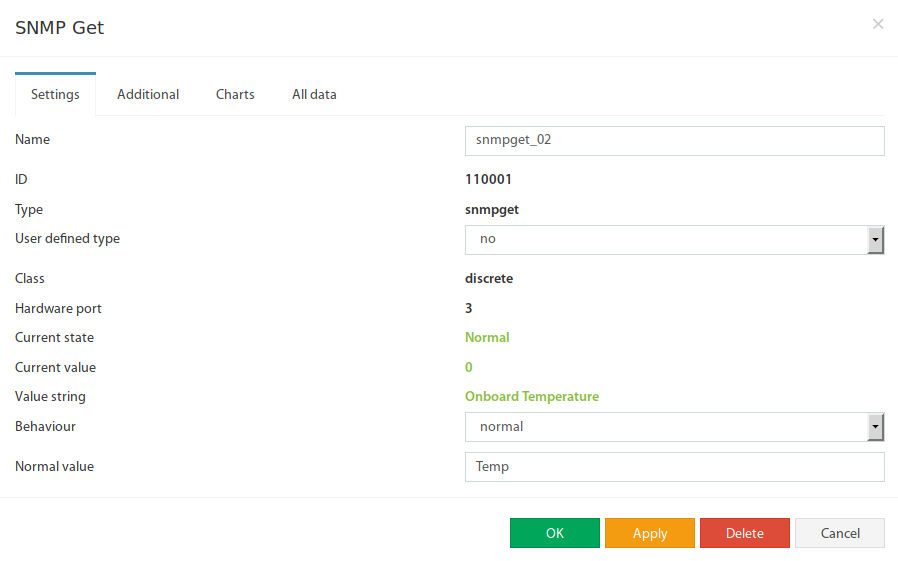
▼The virtual SNMP GET element allows reading data from external devices (switches, routers, servers, UPS, etc.) via SNMP PDU GET (Version 1, 2c or 3). It is available in two variants: analog (numeric value) and discrete (state comparison).
All Didactum Monitoring Systems support the SNMP GET element. The analog sensor interprets the value read via SNMP as a decimal number (e.g. temperature of a switch). The discrete sensor compares the read value with a given pattern: if it matches, the state is Normal – otherwise Alarm.
- Open the System Tree and click on the + symbol.
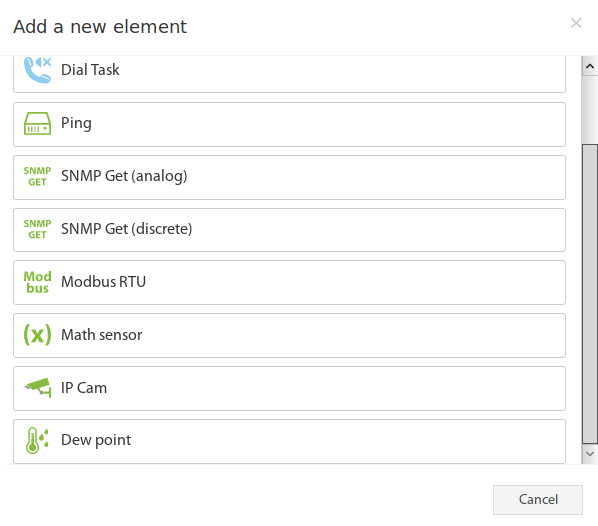
- Select SNMP Get (analog) from the dialog.
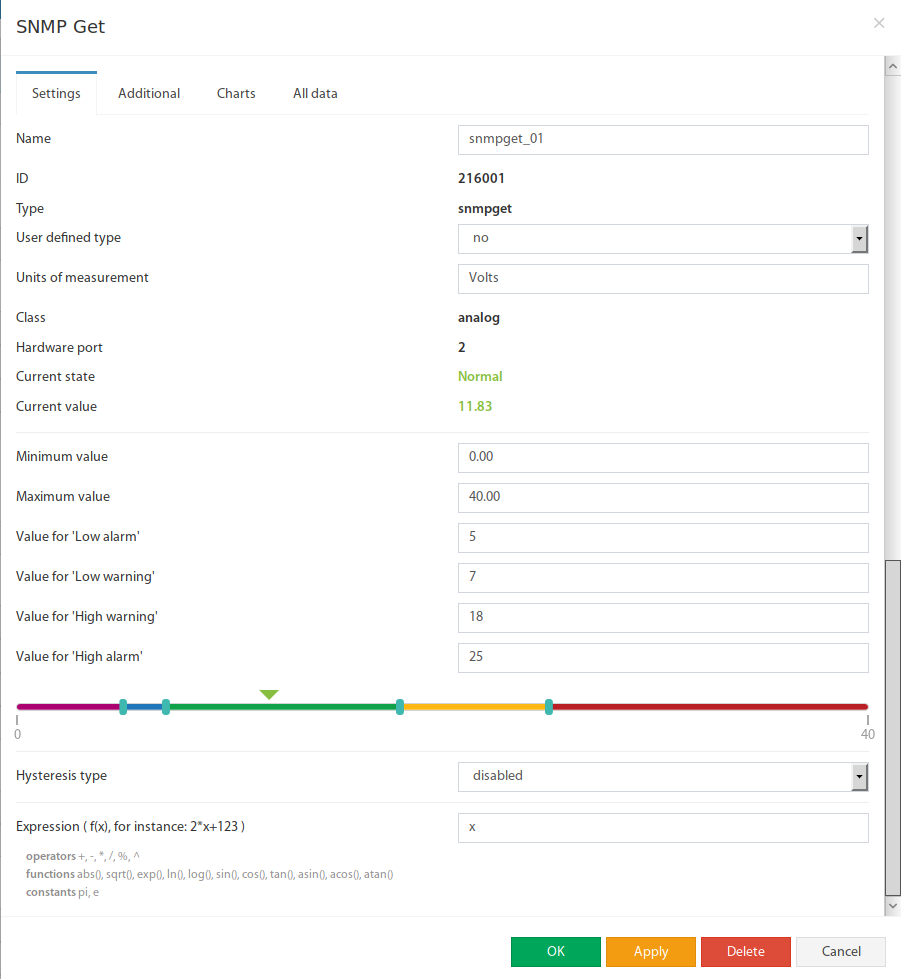
- In the configuration window: enter name, unit, min/max value, threshold values.
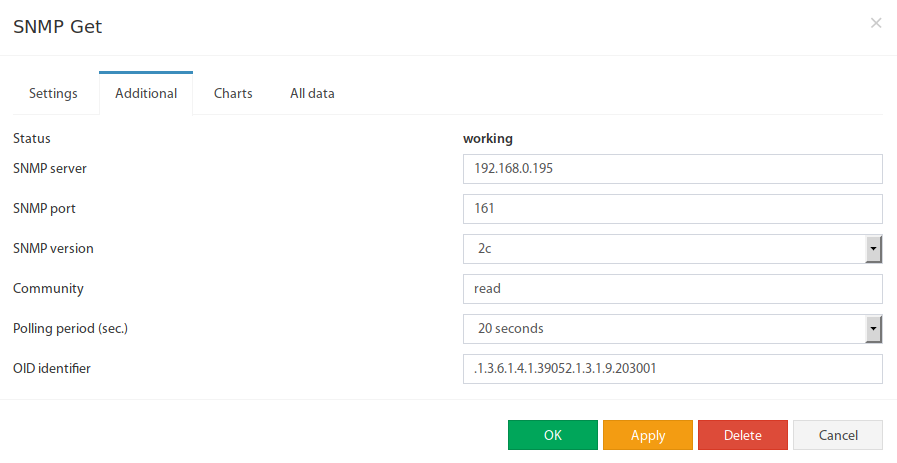
- In the Additional tab: enter SNMP server, port, version (1/2c/3), community and OID.
- Save with OK.
 🔍 Enlarge
 🔍 Enlarge
0.1*x+0.5) allows value transformation.
| # | Parameter | Description |
|---|---|---|
| 1 | Name | Freely selectable element name |
| 2 | Custom Type | Symbol display in the System Tree |
| 3 | Measurement Unit | Unit of the displayed value (e.g. °C, V, %) |
| 4 | Minimum Value | Undershoot → state “Not connected” |
| 5 | Maximum Value | Overshoot → state “Not connected” |
| 6 | Alarm/Warning Levels | Threshold values like other sensors |
| 7 | Hysteresis | Time or value-based hysteresis |
| 8 | Formula | Calculation expression f(x), e.g. 0.1*x+0.5 |
 🔍 Enlarge
 🔍 Enlarge
public) and the OID in numeric format.
 🔍 Enlarge
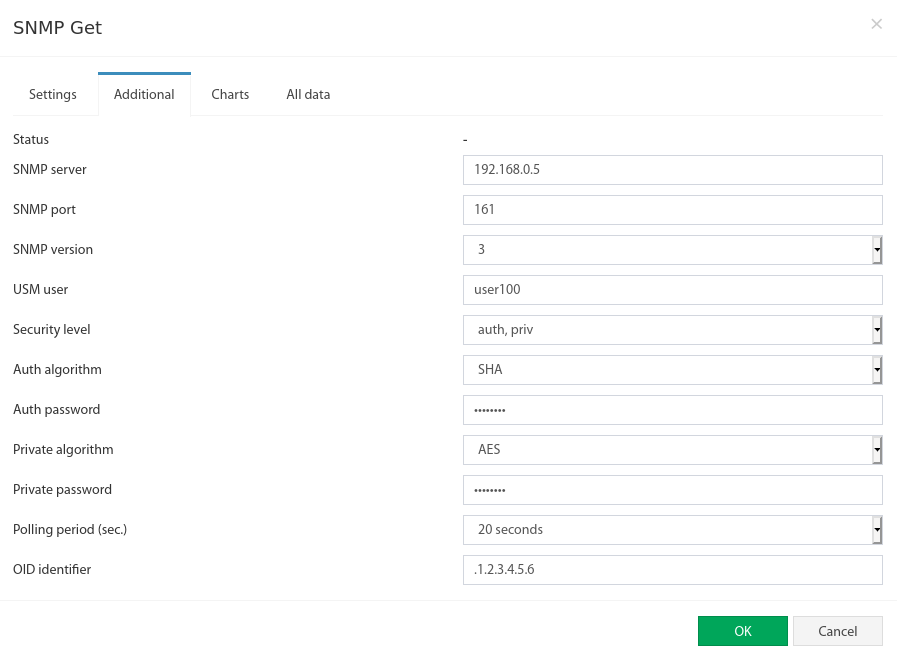
| Parameter (SNMP v3) | Description |
|---|---|
| USM User | Security username |
| Security Level | No Auth/No Priv · Auth Only · Auth + Encryption |
| Auth Algorithm | MD5 or SHA (recommended: SHA256) |
| Auth Password | At least 8 characters |
| Priv Algorithm | DES or AES |
| Priv Password | At least 8 characters |
| Query Interval | Time between SNMP GET requests |
| OID | Object Identifier in numeric format |